
About the post
Many amateur electronics technicians enter the world of microcontrollers (MCU) via the Arduino, as this path is easy to understand even for beginners. I am no exception. In the course of time, however, one also notices that there are even deeper levels into which it is worth getting in. You come across registers, port manipulation, fuse bits, signatures, C programs, etc. and at some point you want to understand these things. However, the Arduino environment is only partially suitable for this purpose.
The next logical step is to get started with Atmel Studio, currently Atmel Studio 7 (Addendum: in 2020 Atmel Studio has been renamed to Microchip Studio). As easy as it is for one to get started with the Arduino, it is so peculiar working with Atmel Studio at the beginning. You get used to it, but first it can be a bit daunting because much of this program is anything but self-explanatory. But it’s worth it and with this post, I want to make it easier for you to get started.
I had already briefly mentioned Atmel Studio in my post about the programming of ATtiny85 & Co, but because of the scope of this topic I could not go into any details. I described suitable programmers for Atmel Studio in my last post. If you have questions about the programmers in this article, they may be answered there.
In detail, this is a step-by-step guide to:
- the installation of Atmel Studio 7
- uploading a simple blink program to an ATtiny85
- debugging and breakpoints
I assume that you have a debugging programmer like the AVR Dragon or the Atmel-ICE. If your programmer is not debugging, you can at least reproduce the first two topics.
Installation of Atmel Studio 7
Atmel Studio 7 is a free development environment for programming Atmel MCUs, which can be downloaded here from the Microchip Technology Inc. website. If you follow the link, there is a web installer and an offline installer. The web installer is the recommended variant. It requires a continuous Internet connection.
The installation is not difficult, as almost everything happens automatically. However, the whole thing takes some time. On a not entirely new laptop, the installation of the entire software package took about half an hour and 4 GB of disk space was needed.
The only major decision to make during installation is which MCU family you want to program with Atmel Studio:
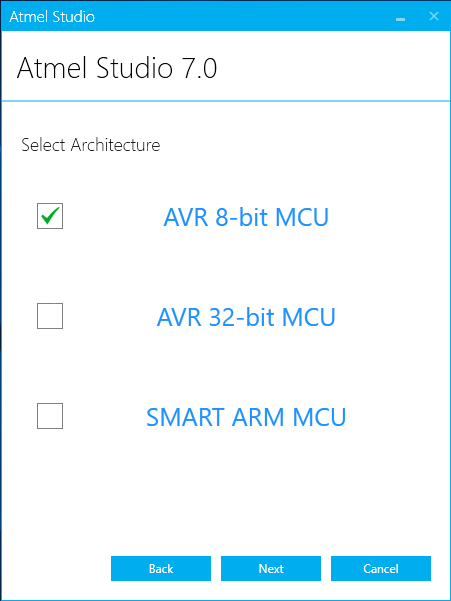
Most likely, the installation of AVR 8, i.e. the package for the 8-bit MCUs, will be enough for you. You’ve covered the ATtiny, ATMega, and AVR XMega families. Since I also installed the other packages, the required disk space for you should be a little less and also the installation time, if you limit yourself to AVR 8.
After the installation, we put the program aside and turn to other preparatory measures.
Wiring
As an example for a first “project” we take as already mentioned a blink program that is uploaded to an ATtiny85 via ISP. The LED shall be switched by the I/O pin PB4.
The ISP port has the following pinout:

The pinout of the ATtiny85 looks like this:

You must now make sure that you connect the programmer according to the connection schemes. So simply MISO to MISO, MOSI to MOSI, VCC to VCC, etc. How you do this in concrete terms and whether you still need an external power source for the ATtiny85 depends on the programmer you are using. You might also use a breadboard adapter or choose on-board programming on the AVR Dragon. If you don’t know what to do, please read my last post.
The example program
Programs (they are not called sketches here) in Atmel Studio are mostly written in C. This looks strange and cryptic for those who know only the Arduino world. A
pinMode(4, OUTPUT); and digitalWrite(4, HIGH);
is compared to the C equivalents
DDRB = (1<<PB4); or PORTB |= (1<<PB4);
of course more self-explanatory. The beauty of the C-code, on the other hand, is that you can see what is happening at the port or register level. In addition, the C-code is several times faster. A concise introduction to port manipulation and bit operations can be found here. Perhaps I will write my own post about the subject, but here it would go beyond the scope.
Here is the example of the blink program:
/*
 * ATtiny85_Blink.c
 *
 * Created: 25.06.2019 18:30:08
 * Author : Ewald
 */

// including libraries:
#include <avr/io.h>
#include <util/delay.h>

int main(void) // Start main program
{
  DDRB = (1<<PB4); // Pin 4 set as output

    while (1) // Corresponds to the main loop at Arduino
    {
    PORTB |= (1<<PB4); // PB4 set HIGH
    _delay_ms(1000); // wait 1000 ms
    PORTB &= ~(1<<PB4); // PB4 set LOW
    _delay_ms(1000); // wait 1000 ms
    }
}
Programming in Atmel Studio 7
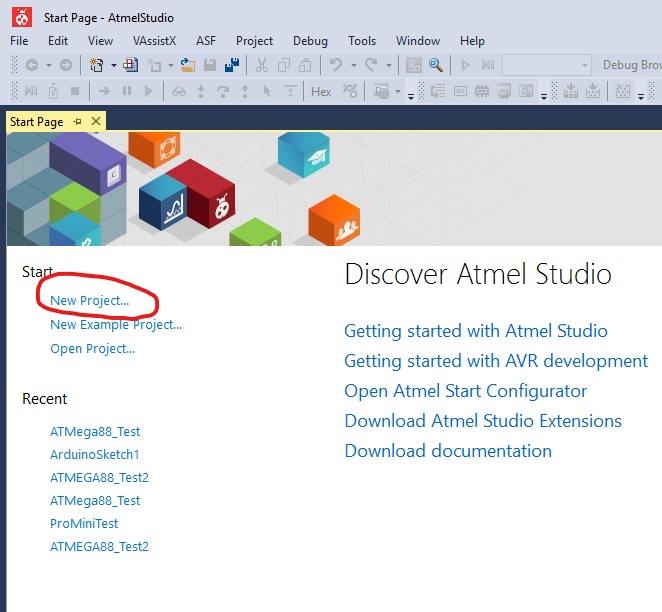
But now back to the newly installed Atmel Studio 7. After opening, select “New Project …”.
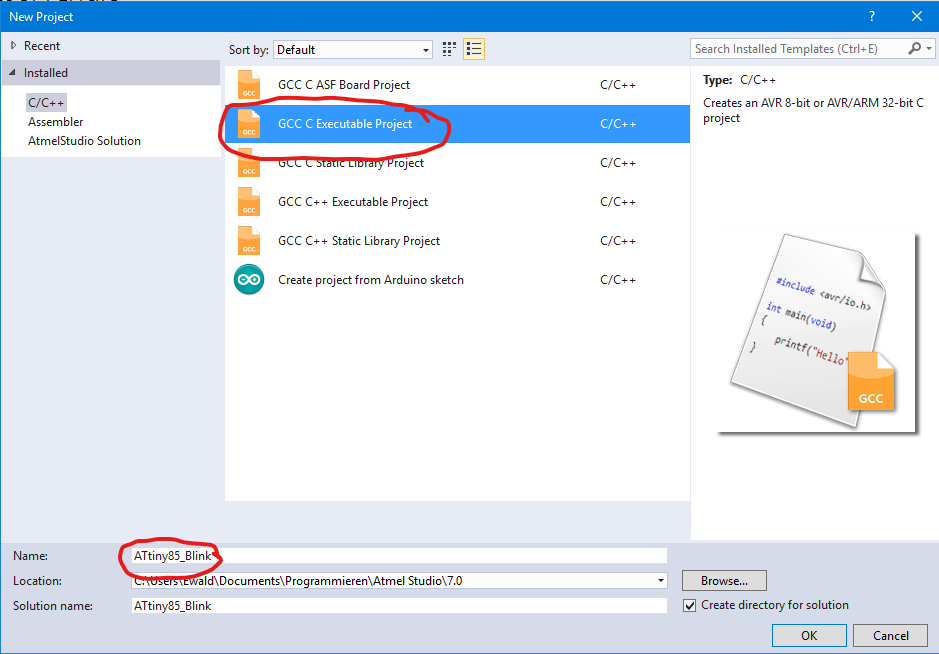
Now choose your “GCC C Executable Project”. If you want to use C++ code, choose “GCC C++ Executable Project”. I will explain in a separate post what the last option “Create project from Arduino Sketch” is all about.
It is important to enter the correct project name here. A later name change is not as trivial as for Arduino sketches.
Then confirm with “OK”.
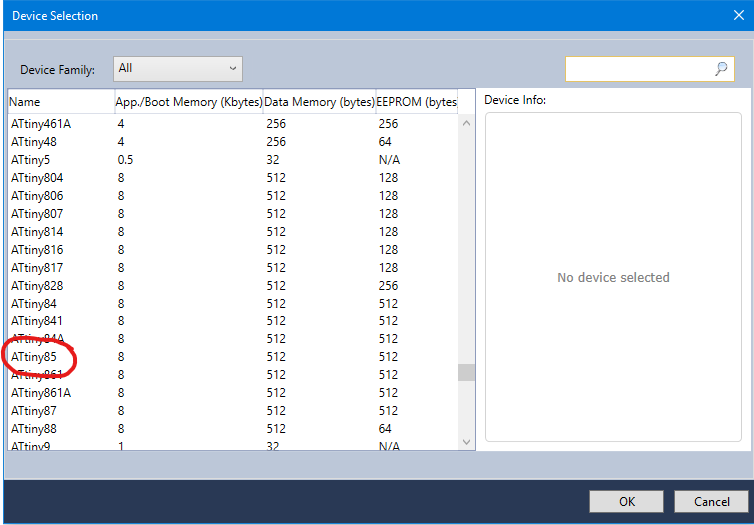
Next you have to choose the MCU, here ATtiny85. The MCU is referred to as a “device” in Atmel Studio.
Then you are already in the editor for the main program, which is called “main.c” by default. Replace it or add the example program.

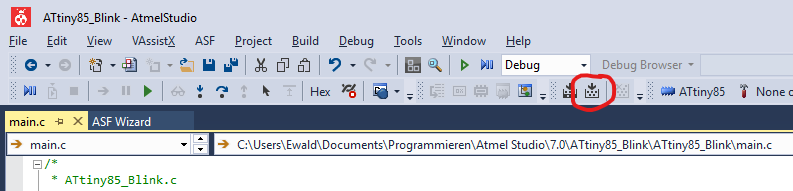
If you have entered the program, you can test it for syntax errors. To do this, go to the marked “Build Solution” icon. A number of messages appear in the output window below – and hopefully there is no error message.
Most features, such as Build Solution, are accessible not only through the icons, but also through the drop-down menus and keyboard shortcuts. I am sticking to the symbols.
Tool selection and MCU settings in Atmel Studio 7
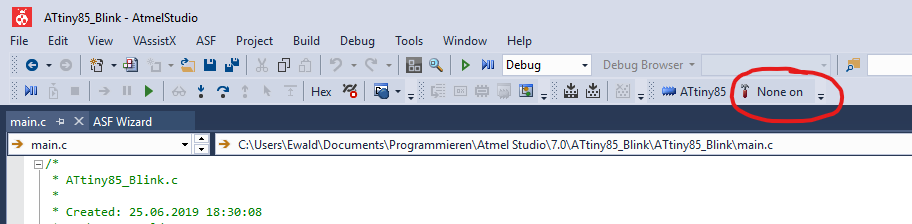
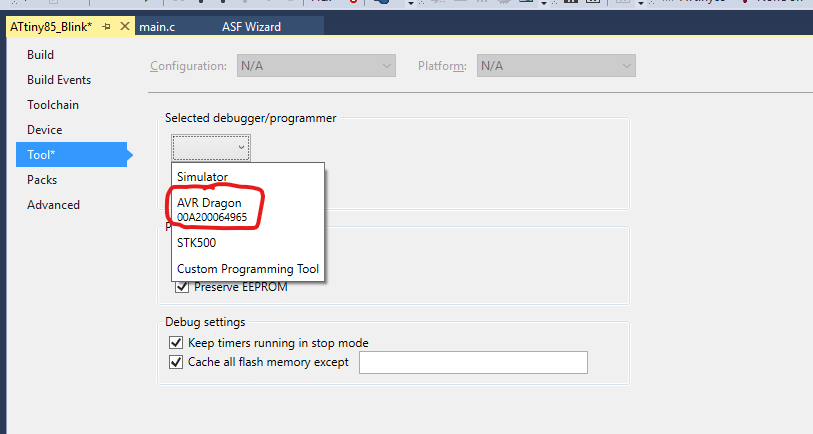
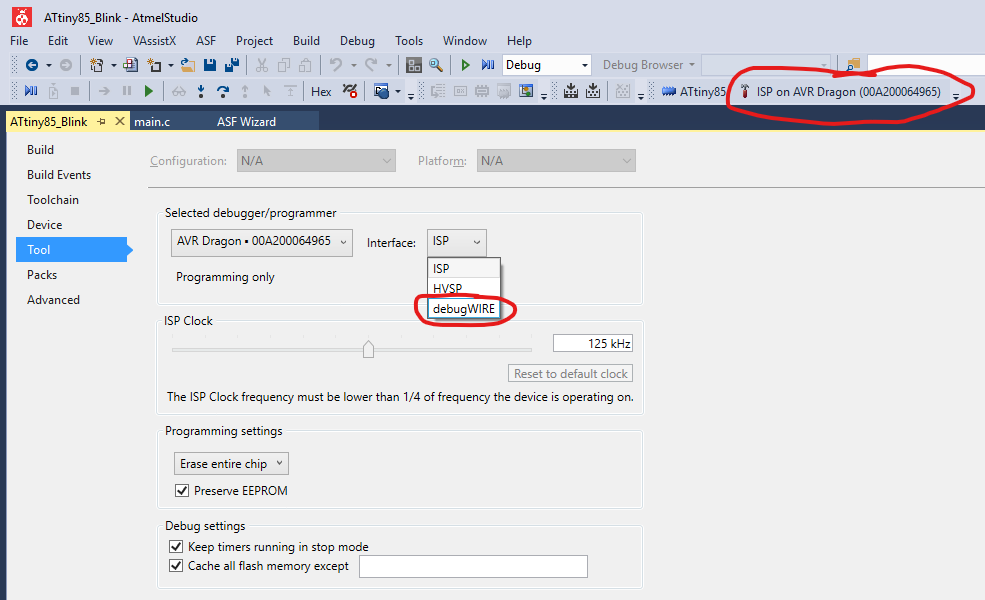
The programmer is referred to as a “tool” in Atmel Studio. The tool selection is done via the symbol with the hammer (a rather coarse symbol, I think).
In my example, I choose the Dragon. It must be connected to the PC for it to appear as a selection.
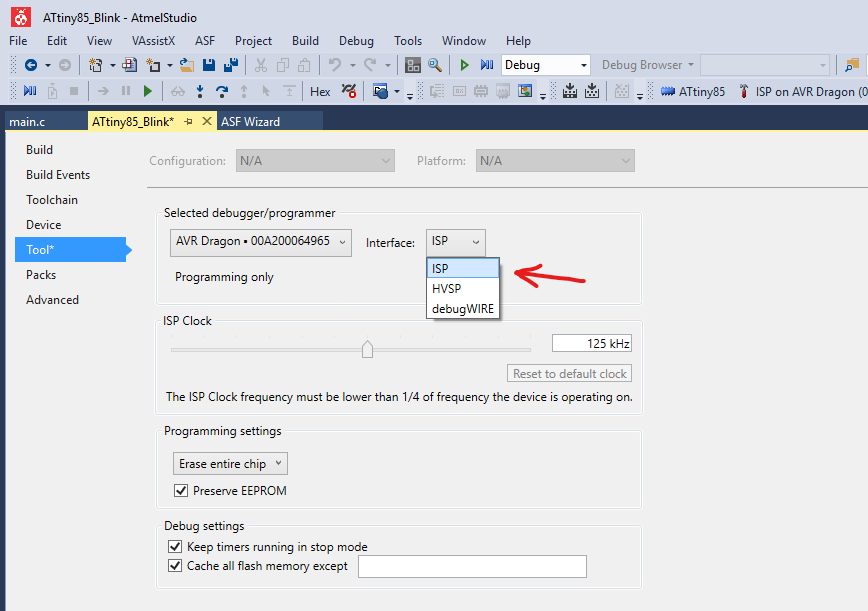
Now you have to make a few more settings in the ATtiny85. This can only be done in ISP mode, which you select via a drop-down menu.
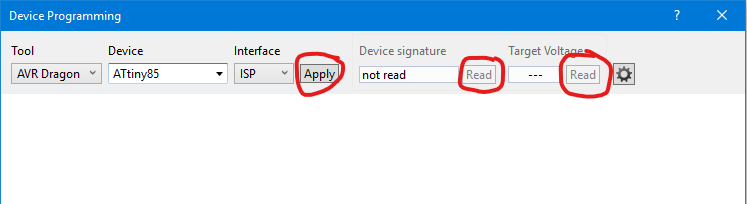
Now you click on the small icon with the IC and the flash (“Device Programming”). If the tool, device and interface are correct, click on “Apply” in the pop-up window. Then you can query the signature of the MCU (Device Signature) and the voltage on the MCU (Target Voltage) by clicking on “Read”. Remember: the AVR Dragon, the Atmel-ICE and some other programmers cannot power the MCU. An external voltage source must be used. Nevertheless, GND and VCC of the ISP connection must also be connected.

Now you can turn to the infamous fuse bits.
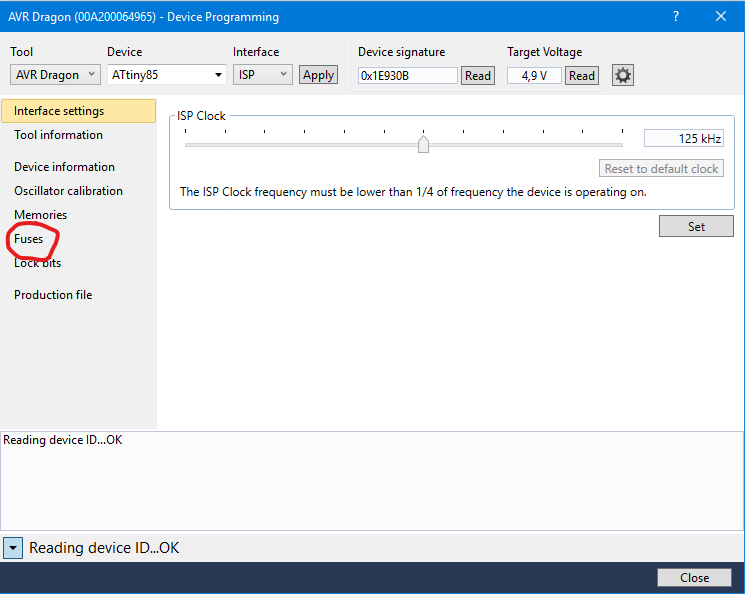
With the fuse bits you have to pay a little attention to what you do, because you can easily lock yourself out. This can only be undone with an HVSP-enabled programmer like the AVR Dragon.
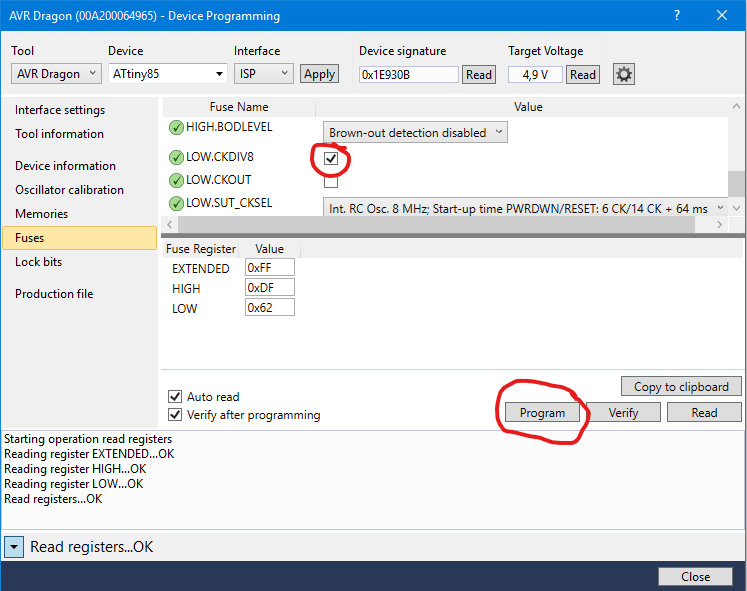
A “virgin” ATtiny85 has usually activated the so-called clock divider. He divides the clock by 8. Responsible for this is the fuse bit CKDIV8. Untick the check box and click “Program”.
If you’ve previously programmed your ATtiny with the Arduino at 8 MHz, the tick shouldn’t be set.
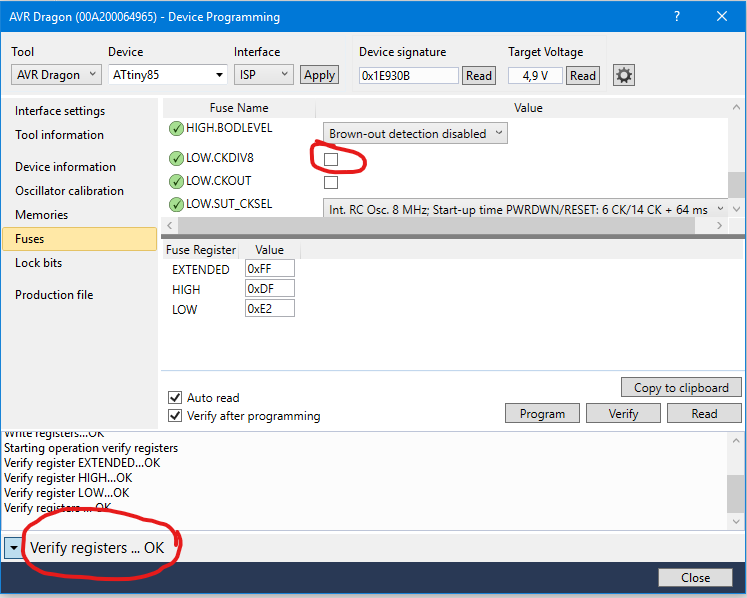
If everything works, the tick has disappeared and below you receive the message “Verify Registers … OK”.
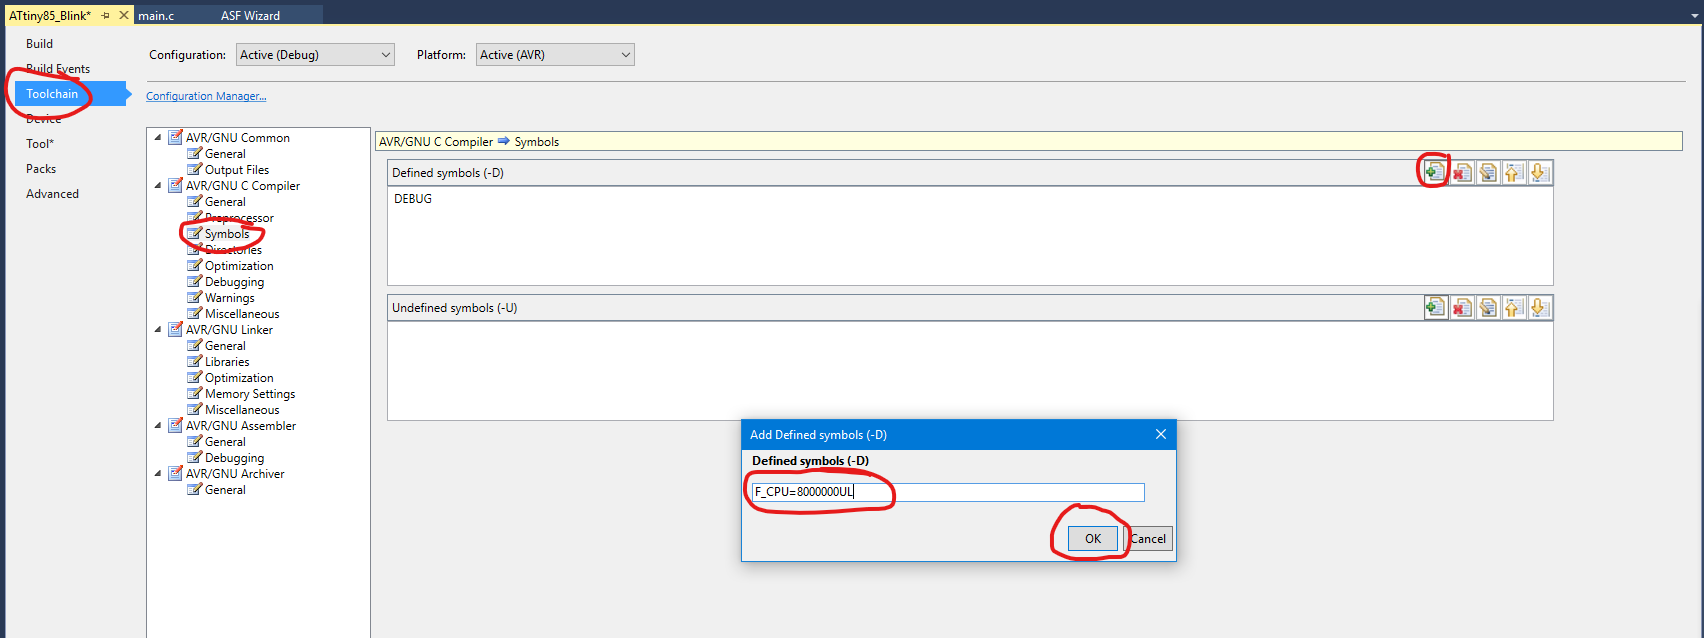
One preparatory activity is still missing: we have to tell Atmel Studio the clock frequency. To do this, you close the device programming window, go to the tools (hammer icon) and select “Toolchain”. Click on “Symbols”, then on the “Add Item” symbol and enter “F_CPU=8000000UL” in the dialog box. As an alternative to these steps, you can use the line in the program
#define F_CPU 8000000UL
in the program code (before the includes!). That’s it.
Upload and debugging in Atmel Studio 7
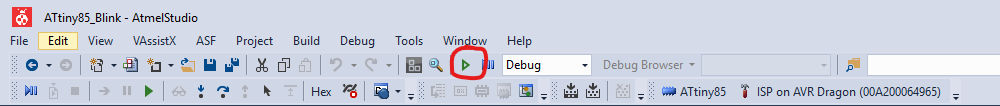
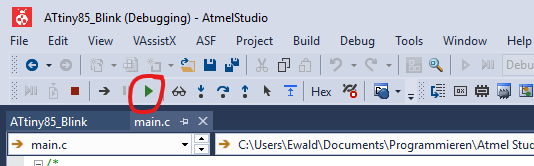
Unless you want debugging (or the programmer can’t) or you’re curious if everything works, you can now click on the green, unfilled triangle (“Start Without Debugging”). The program is uploaded and if you have already connected the LED, it should flash at the correct frequency.
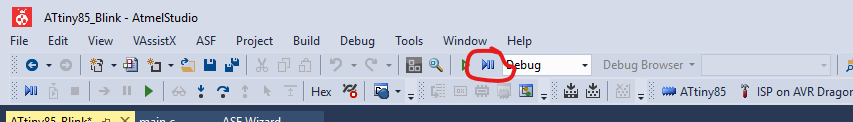
To run the program in debugging mode, click on the icon with the Play/Pause sign (“Start Debugging and Break”).
If you have followed these instructions, you are still in ISP mode and will receive the following error message:
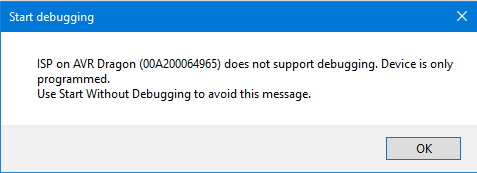
So you need to switch from ISP mode to debugWire mode. To do this, you go back to the tool area and choose debugWIRE as the interface. The debugWire mode does not have a separate port – it also runs over the ISP connection.
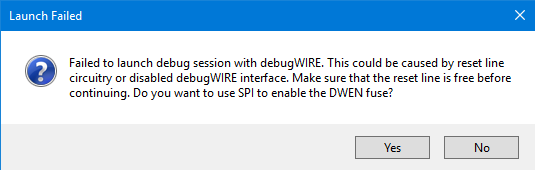
You try again and get an error message because the DWEN (debugWire Enable) fuse bit is not enabled. The good news: if you quit with “Yes”, Atmel Studio makes this setting.
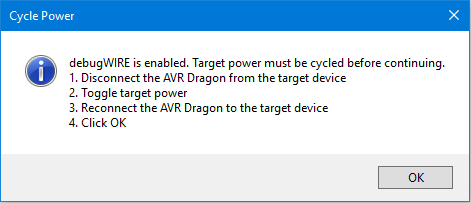
The bad news: you get another error message because the MCU needs to be restarted. Disconnect the AVR Dragon from the MCU, briefly disconnect the power supply to the MCU, reconnect the Dragon, and click OK.
I always save myself steps 1 and 3, i.e. I only briefly disconnect the power supply from the MCU and it still works. Follow my way at your own risk!
The program starts now, but then stays in the first program line.
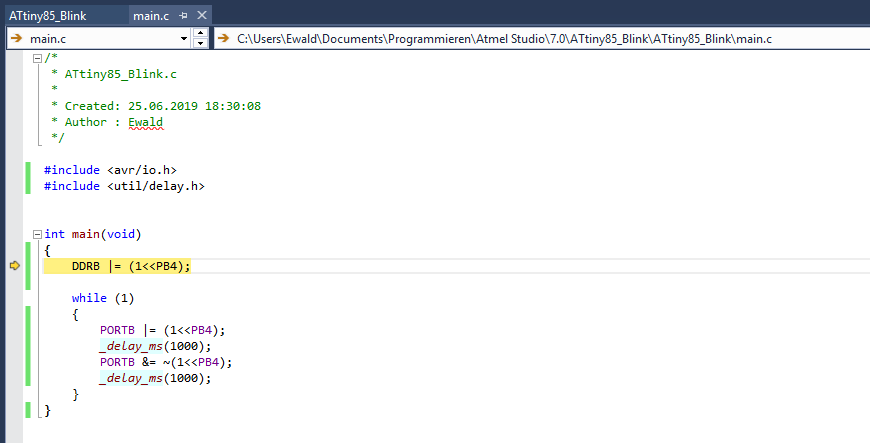
If you now click on the full green triangle (“Continue”) the program will continue as normal.
Of course, this procedure does not yet offer any real advantage. This changes with the step-by-step execution of the program. First of all, the debugging stops by clicking on the reddish-brown square.

Step-by-step execution and register tracking
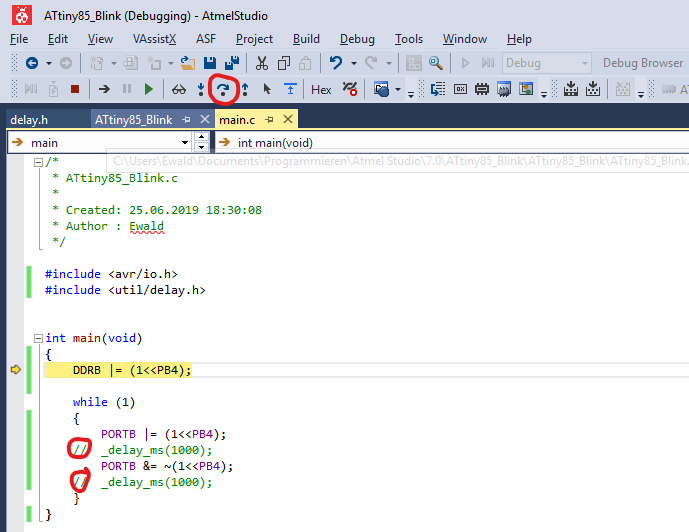
There are two methods to run programs step by step. The first method requires commenting the delay commands. This is not necessary for the second method, the breakpoints, which are discussed below.
But first of all, the first method. Comment the delay commands and select “Start Debugging and Break” (the play-stop icon). Then click on the “Step Over” icon. With each click on the icon, the program jumps one line further. You will see that the stop is done in the current line before the command is executed. The current line is marked by a yellow arrow.
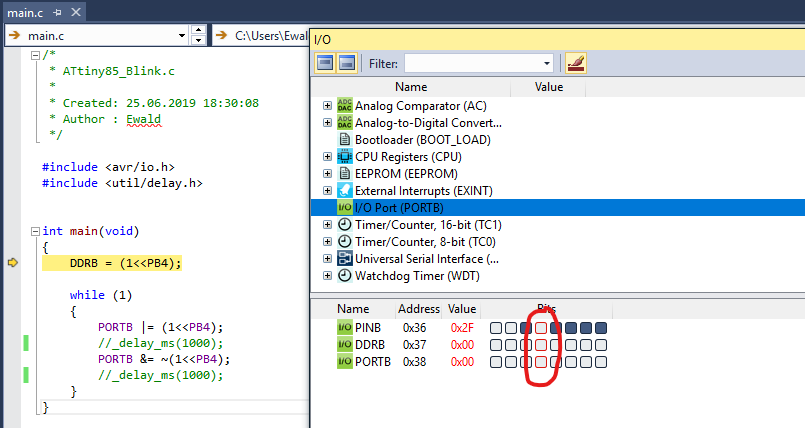
Now you can track register contents. Click on the I/O icon. The I/O window opens. Click on “I/O Port (Port B)”. A window pops up which indicates the status of the PINB, DDRB, and PORTB registers. In order to be able to track the change of the registers depending on the program line, detach the I/O window from its anchorage and drag it next to the main.c window. Then click on “Step Over” a few more times and see what happens:


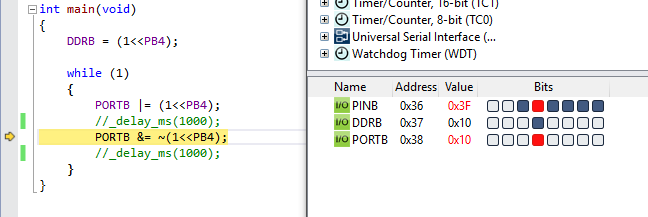
Pretty cool, I think.
Now let’s leave the debugWire mode. It is not enough to click stop debugging (red-brown square). Unfortunately, there is no icon for this operation. Instead, go to the menu:
Debug — > Disable debugWIRE and Close

If you only go to “Stop Debugging” and then try to make settings in ISP mode via Device Programming in ATtiny, you get strange error messages that you can’t really assign to the fact that you are still in debugWire mode. At first, this often confused me as much as it annoyed me.
Track variables and set breakpoints
To see how to track variable content, we first need a variable in our program. We define a (admittedly quite meaningless) variable x with a starting value of 0. At several points in the program we insert an x++:
/*
 * ATtiny85_Blink.c
 *
 * Created: 25.06.2019 18:30:08
 * Author : Ewald
 */

#include <avr/io.h>
#include <util/delay.h>
uint8_t x=0;

int main(void)
{
  DDRB = (1<<PB4);
  x++;

    while (1)
    {
    x++;
    PORTB |= (1<<PB4);
    x++;
    //_delay_ms(1000);
    PORTB &= ~(1<<PB4);
    x++;
    //_delay_ms(1000);
    }
}
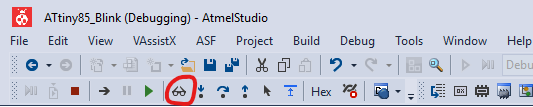
Restart the program in debugWire mode via “Start Debugging and Break”. After the break, you can click on the icon with the glasses. If debugging has not yet started, the glasses icon is grayed out.
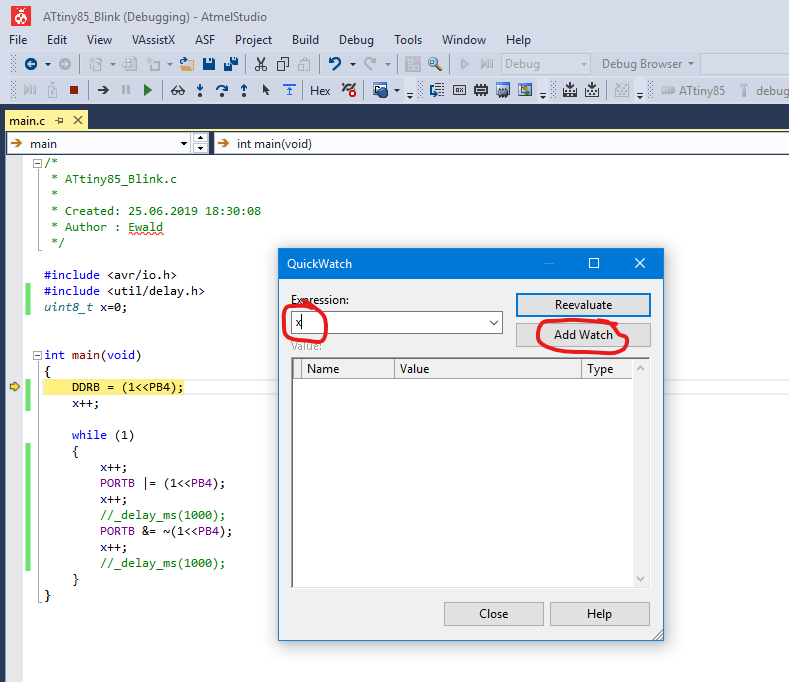
With the click on the glasses, a window opens. There you “x” in the box “Expression” and click on “Add Watch”. Alternatively, you can right-click on the variable in the program code and then select “Add Watch” in the context menu.
Now you can go through the program with “Step Over” and track how x increments.

It’s annoying, of course, when you always have to comment all the delay commands. Also, you certainly don’t want to execute every line individually for large programs. A better method is to set breakpoints, i.e. points at which the program stops in debugWire mode.
You set a breakpoint by simply clicking on the left, grey stripe at the height of the selected line. A red dot appears. You delete a breakpoint by simply clicking on it again.
So uncomment the delay commands, set one or more breakpoints and start the program with “Start Debugging and Break”. Then click on the green “Continue” triangle.
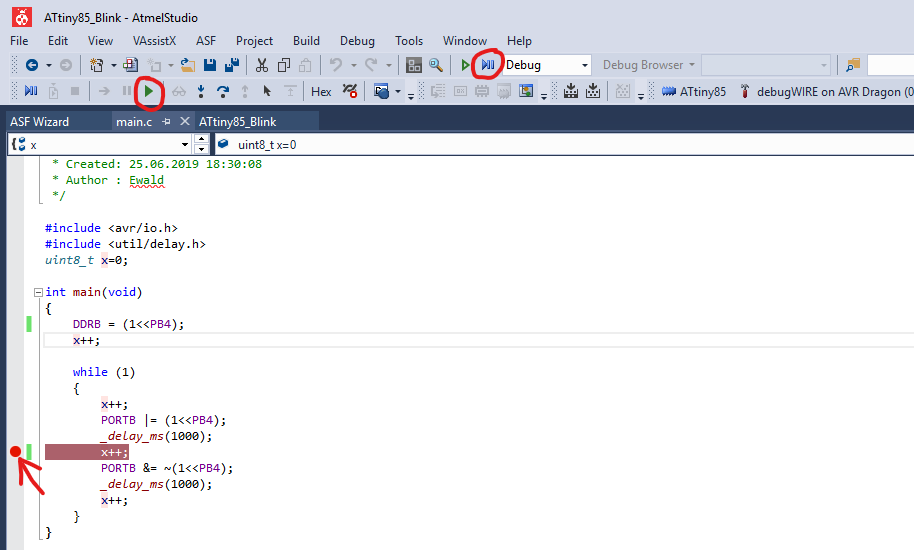
You will see that the program stops at the breakpoint. The line that contains the breakpoint will not be executed before you continue. Another “Continue” allows the program to continue until the next breakpoint or in this example until the program reaches the same breakpoint again.

So you know the basics and can turn to more complex things.
In the next post I will show how to implement debugging into the Arduino world with Atmel Studio 7, so to speak, connecting both worlds.