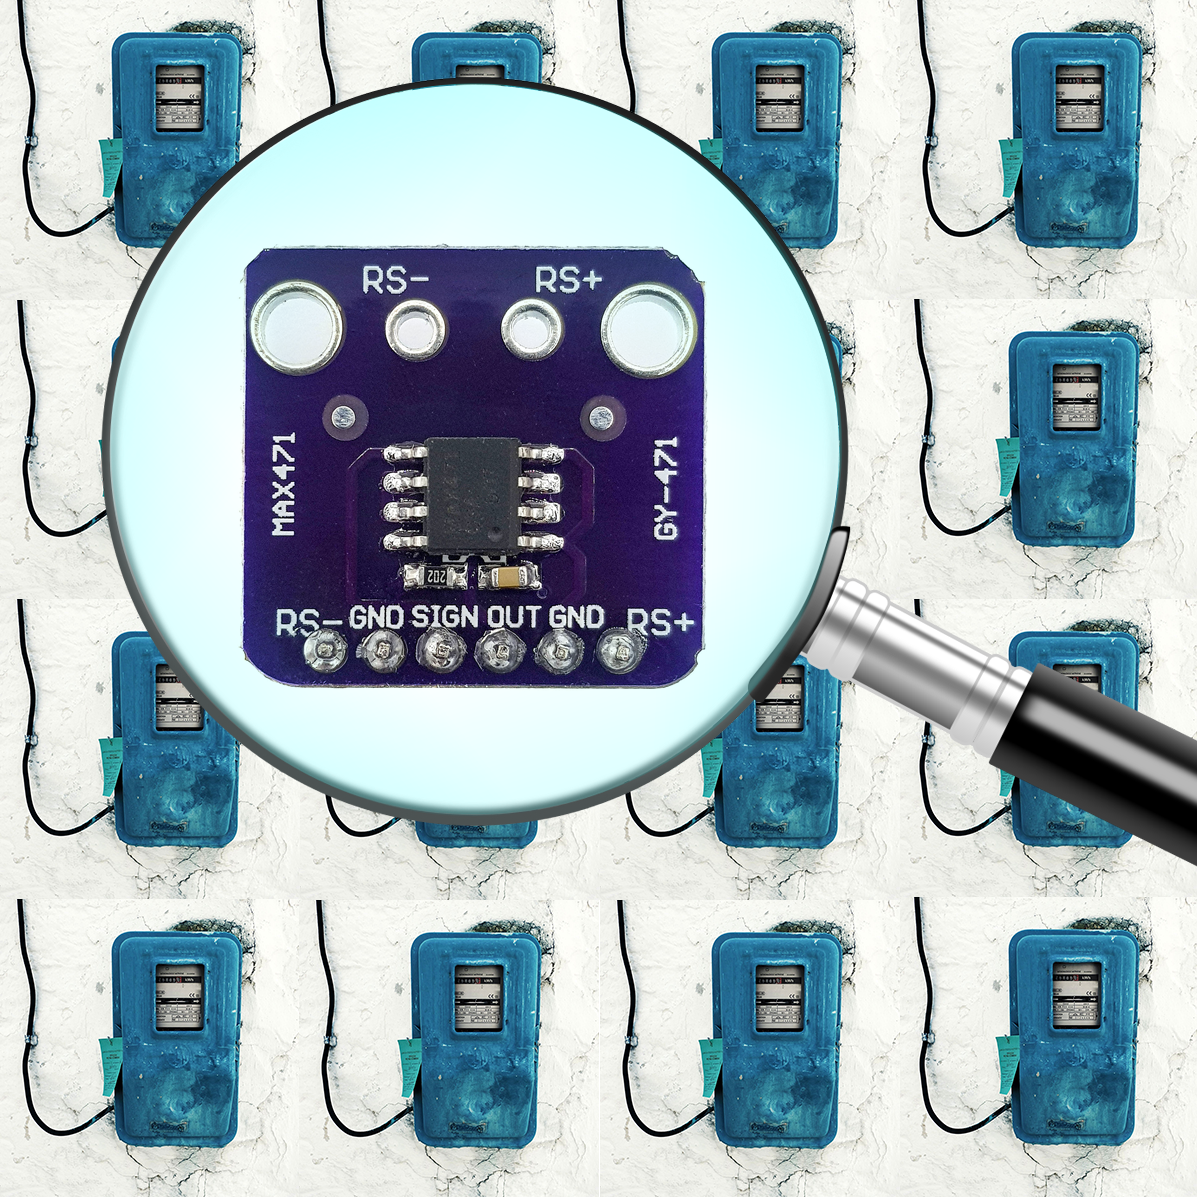
About this post
With this article, I would like to further complete the series on current sensors with the MAX471. One or the other regular reader may already be bored – but I want to have the most important current sensors treated all. The blog shall also serve as a reference tool.
Technical features of the MAX471
The heart of the MAX471 modules is the actual MAX471 IC. The data sheet can be found here. The MAX471 is designed to measure currents up to 3 amperes. Internally, it uses a shunt (= small resistor for current measurement) of 35 milliohms, through which the current to be measured is sent. The MAX471 amplifies the voltage drop across the shunt and outputs it to the OUT pin. The voltage at OUT is always positive regardless of the current direction.
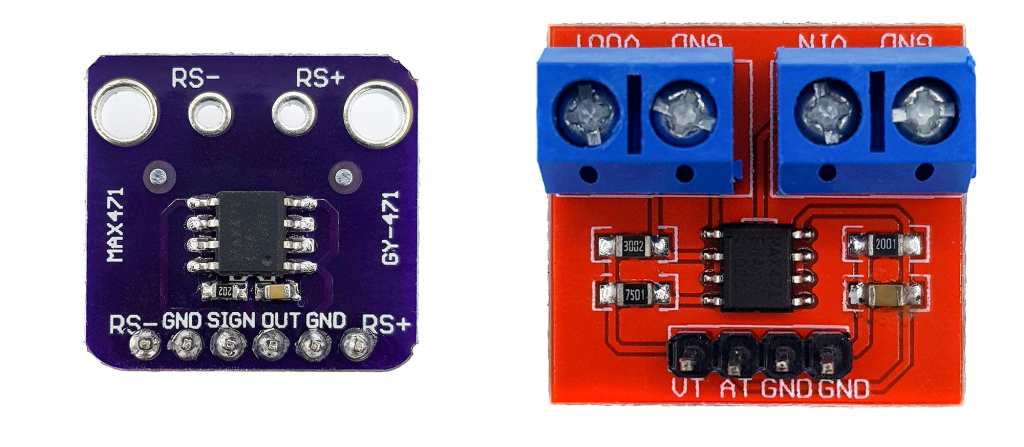
I found two versions of MAX471 modules that are a little different in their design and properties:
First of all, however, the similarities. Both modules have no connection for a power voltage. The MAX471 takes the power required for itself from the circuit to be measured. The modules are integrated into the circuit via their RS+/RS- or VIN / VOUT connections. The voltage must be in the range of 3 to 36 volts. This means that the MAX471 must be connected on the high-side, i.e. on the V+ side.
The bare MAX417 has an additional shutdown pin that can be used to put it into a sleep mode. The modules unfortunately don’t use that pin.
The most important data at a glance
- Maximum current: 3 amperes.
- Voltage range: 3 – 36 volts.
- Power consumption: < 100 microamperes.
- in sleep mode (IC only): < 18 microamperes.
- Shunt: 35 milliohms (internal).
- Sensitivity: approx. 1 volt / ampere.
Differences between the MAX471 modules
Model at the top left (purple module):
- Current connections: RS+ / RS-
- Signal: OUT
- SIGN: Indicates the current direction
Model at the top right (red module):
- Current connections: VIN / VOUT
- Signal 1 (1 Volt / ampere): AT
- Signal 2 (0.2 volts / ampere): VT
- The SIGN pin is not used
The signal 2 is generated by a voltage divider on the module from the signal 1. The voltage divider consists of the 30 kOhm and the 7.5 kOhm resistors, which you can see on the module.
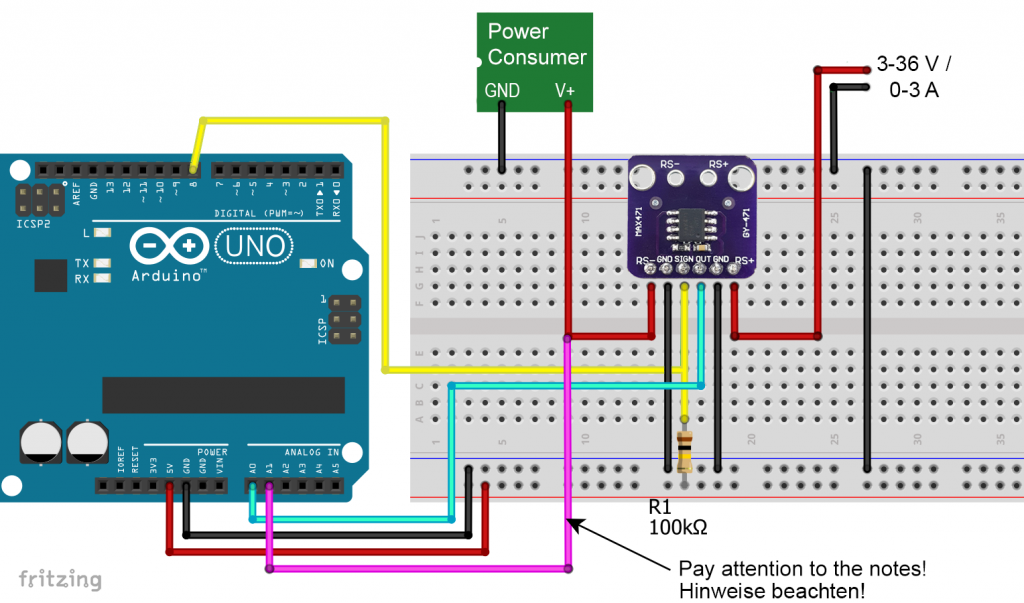
Connecting the MAX471 to the Arduino
Wiring
This is what your circuit for the purple module might look like if you are using an Arduino UNO:
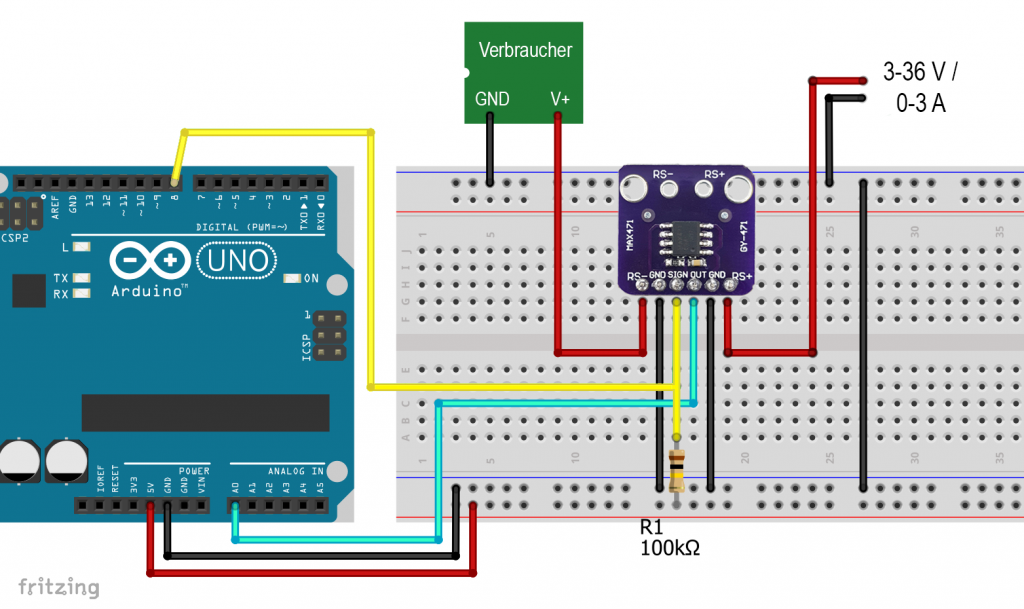
The OUT signal is read at the analog input A0. The SIGN pin is an open collector input. It is closed when the current flows from RS+ to RS- and is open when current flows in the other direction. You can check this by attaching a pull-up resistor and then reading it via digitalRead(). A HIGH or 1 would indicate that the current is flowing from RS+ to RS-
The wiring of the alternative red module is no longer a surprise. Most are more likely to use the more sensitive AT output than VT.

Calibration
If it doesn’t matter that much, you can just start now and determine the current according to this formula:
![\[ I\,[\text{mA}]=analogRead(A0)\cdot\frac{5000}{1024} \]](https://wolles-elektronikkiste.de/wp-content/ql-cache/quicklatex.com-569cdb42ff4eddcf5db69ef81a59ed30_l3.png "Rendered by QuickLaTeX.com")
If you want to measure more accurately, you can calibrate your MAX471 with your trusted ammeter. In my experience, most multimeters provide fairly precise values. And if you stay below one ampere in your current measurements, you can increase the resolution of the Arduino A/D converter with analogReference(INTERNAL). This causes the Arduino UNO or the ATmega328P to use an internal 1.1 volt source as a reference. Simply put, an analogRead result 1024 no longer corresponds to 5, but 1.1 volts.
To create a calibration curve, you can use devices with different current consumption that you insert into the circuit. To read out the A/D converter I used the following sketch:
void setup() {
  Serial.begin(9600);
  analogReference(INTERNAL); // // adjust, if you use another MCU
}

void loop() {
  unsigned int rawVal = 0;

  for(int i=0; i<25; i++){
    rawVal += analogRead(A0);
    delay(10);
  }
  float meanRawVal = (rawVal / 25.0);
  Serial.println(meanRawVal);
  delay(2000);
}
Since the measured values fluctuated quite strongly, 25 individual values are averaged. The voltage in millivolts is obtained by multiplying the raw values by 1.1/1023. That’s what I let Excel do for me. In addition, Excel has created a regression line (trend line) for me. I inserted the voltage values in the equation of the regression line (calculated current). The calculated current is surprisingly well in line with the measured values:
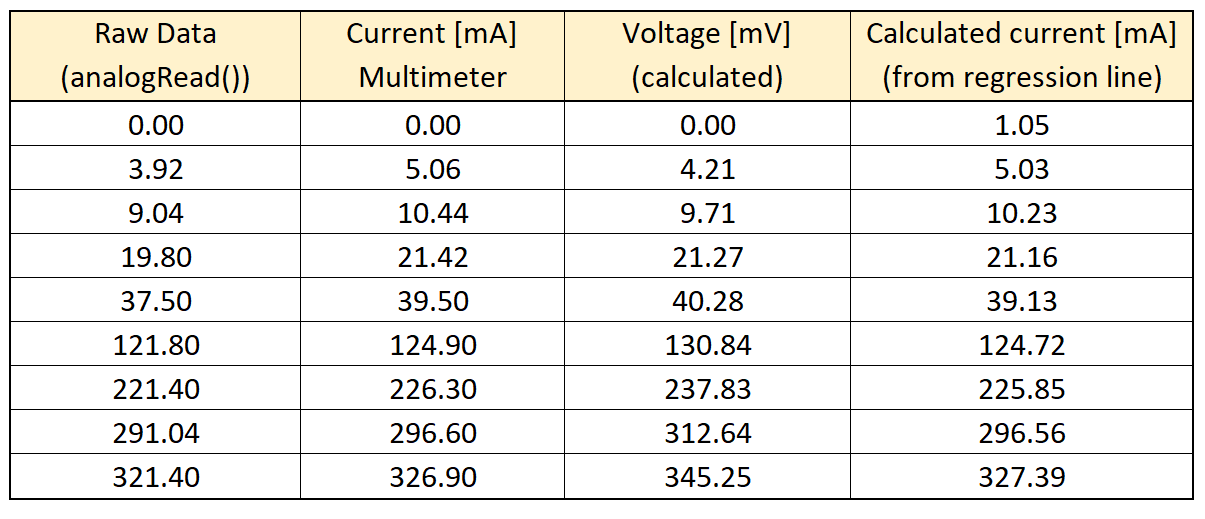

Actually, the slope of the calibration straight should be 1 mA/mV, instead it is 0.9452. That is a deviation of just over 5 percent. So, the effort is worth it if you want to measure the current accurately. I repeated it again with my favorite A/D converter, the ADS1115. The calibration line had a slope of 0.948. It all fits together pretty well.
The complete power and power sensor
Now you can use the calibration line to determine currents. You can also use the current sensor to determine the consumer’s power P. All you have to do is measure the voltage on the consumer’s V+. You already know the current (called bus current).
![\[ P = U_{V_{+}}\cdot I_{Bus} \]](https://wolles-elektronikkiste.de/wp-content/ql-cache/quicklatex.com-98a1e60a181ae3e1cb32df15f90bd867_l3.png "Rendered by QuickLaTeX.com")
But beware: if the power source provides a voltage greater than 5 volts for the consumer, you absolutely need to set a voltage divider between V+ (consumer) and A1 (Arduino). Otherwise you will destroy the Arduino!
The complete sketch probably doesn’t need much more explanation, except for one point. The reference for the A/D converter changes in the main loop between 5 volts (DEFAULT) and 1.1 volts (INTERNAL). After switching to 1.1 volts, I had initially detected strangely low values. This effect can be counteracted by performing a dummy analogRead(), followed by a short delay (line 18-20).
const int outPin = A0;
const int busPin = A1;
const int signPin = 8;

void setup() {
  Serial.begin(9600);
  Serial.println("MAX471 Strom- und Leistungssensor");
  Serial.println();
}

void loop() {
  float voltage = 0.0;
  unsigned long rawVal = 0;
  analogReference(INTERNAL);

  /* After switching you have to execute a dummy analogRead,
     followed by a short */
  rawVal = analogRead(outPin);
  rawVal = 0;
  delay(10);


  for(int i=0; i<25; i++){
    rawVal += analogRead(outPin);
    delay(10);  // 25 measurements to reduce noise
  }

  voltage = (rawVal/25.0) * 1100.0 / 1023.0;
  Serial.print("V Out         [mV]: ");
  Serial.println(voltage);

  float current_mA = voltage * 0.9452 + 1.0544; // Calibration parameters
  Serial.print("Busstrom      [mA]: ");  // Bus current
  Serial.println(current_mA);

  Serial.print("Stromrichtung:    : ");  // Current direction
  if(digitalRead(signPin)){
    Serial.println("RS+ -> RS-");
  }
  else{
    Serial.println("RS- -> RS+");
  }

  analogReference(DEFAULT);
  voltage = analogRead(busPin) * 5.0 / 1023.0;
  Serial.print("Busspannung    [V]: "); // Bus voltage
  Serial.println(voltage);

  float power_mW = (voltage * current_mA);
  Serial.print("Leistung      [mW]: ");  // Power
  Serial.println(power_mW);

  Serial.println("-------------------------------");
  delay(2000);
}
And this is what the result looks like on the serial monitor:
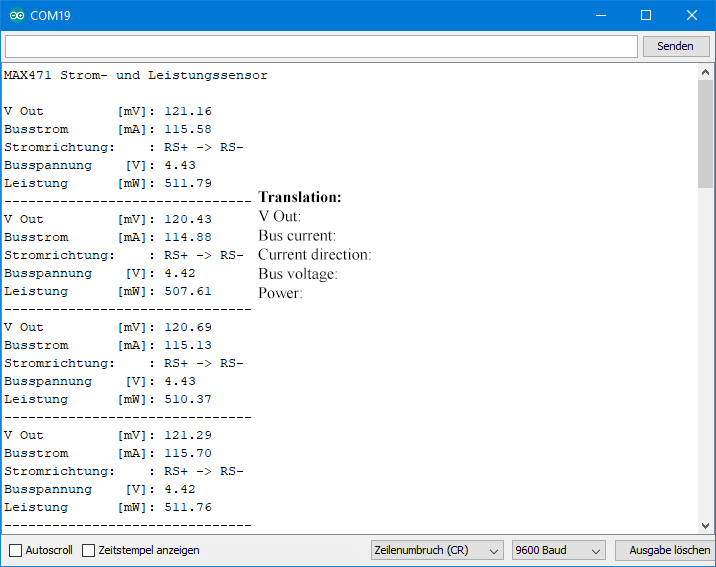
I could achieve even more stable values with fluctuations of well below one milliampere by using the ADS1115 A/D converter. But the result using the Arduino A/D converter is not bad either.
Acknowledgement
As usual, I used Pixabay again for parts of my post picture:
- I took the magnifying glass from OpenClipart-Vectors.
- The already frequently used electricity meter is from the free-photos section.
Hi, I’m trying to connect this sensor with esp32 to measure the current of a solar panel that gives (18V -50WATT) and while searching I found out that some calibrations need to be done to get the correct value. Is that right or should I only use the code you provided and measure the current using this formula current = analogRead(outPin) * 3.3 / 4096.0; **+ Do I need to do any modification to the hardware?
Hi, there are two things two consider. First, the MAX471 has a certain deviation (I found ~5%). Second, the ADC performance of the ESP32 is rather weak. It is quite linear between ~0.15 and ~2.6 V but beyond these limits the values a not very reliable. The deviations caused by the ESP32 will be much higher compared to the deviations caused by the MAX471 itself. I have compared real voltages against measured voltages on an ESP32 here:
https://wolles-elektronikkiste.de/en/programming-the-esp32-with-arduino-code#analog_pins
To solve the issue related to the ESP32 you could use an external ADC (e.g. an ADS1115) or you do a calibration like I did in this article. I am not aware of any hardware modification that could help.
Good luck!
How i can connect this sensor to read voltage, range is 24v to 28v
First, this is a device to measure the current, not voltage. It outputs a voltage which is proprtional to the current. So, I assume you want to measure currents of a load which is supplied with 24 to 28 volts, right?
You connect the positive side of your power supply for the load side to RS+ and the negative side to GND. RS- shall be connected to the positive input of your load and the negative side of the load shall be connected to GND. Like I have shown it in the first circuit in this article. I have just seen I did not translate “Verbraucher”. “Verbraucher” is the load.
If you want to measure a voltage of 24 to 28 volts you can’t do it directly. You need a voltage divider to apply not more than VCC of your Arduino.
Good morning,
Thanks for this awesome circuit.
I’d like to use it in an ESP32-WROOM but I can’t figure out how to overcome the analorReference problem. Would you have any suggestions?
Thanks again.
Hi, the reference voltage of an ESP32 is 3.3 volts, and you can’t change it. So, you will have to delete the line with the analogReference() command. The current will be calculated as follows:
I = 3.3 * analogRead(pin) / 4096.
There is another issue: Unfortunately, the ADC of the ESP32 is not linear or at least not linear over the complete range:
https://wolles-elektronikkiste.de/en/programming-the-esp32-with-arduino-code#analog_pins
So, with an ESP32, you will get only rough results.
Thank you so much for the reply.
Following the link you recommended I modified the code as shown. Obviously it doesn’t work. Voltage and current, having the same formula, always give 3.3V at output.
Can you give me an idea on how to solve this unpleasant problem?
Thanks again and sorry for the inconvenience.
const int outPin = 0;
const int busPin = 2;
const int signPin = 4;
void setup() {
Serial.begin(9600);
Serial.println(“MAX471 Strom- und Leistungssensor”);
Serial.println();
}
void loop() {
float voltage = 0.0;
float current_mA = 0.0;
unsigned long rawVal = 0;
/* After switching you have to execute a dummy analogRead,
followed by a short */
rawVal = analogRead(outPin);
rawVal = 0;
delay(10);
for(int i=0; i RS-“);
}
else{
Serial.println(“RS- -> RS+”);
}
voltage = analogRead(busPin) * 3.3 / 4096.0;
Serial.print(“Voltage [V]: “); // Bus voltage
Serial.println(voltage);
float power_mW = (voltage * current_mA);
Serial.print(“Power [mW]: “); // Power
Serial.println(power_mW);
Serial.println(“——————————-“);
delay(2000);
}
Hi,
voltage = analogRead(busPin) * 3.3 / 4096.0; -> this will provide the bus voltage. When the power supply for the load is 3.3 volts, then your result of 3.3 volts is fine!
To calculate the current you need to take the voltage from your outPin:
current = analogRead(outPin) * 3.3 / 4096.0;
And yes, the formula for the current and the voltage of the outPin is the same because:
Ibus = Uout
That makes things easy but it’s also a confusing. It’s just an effect of the design (shunt and gain) of the MAX471.
Hope this helps!
Hello I have a question.
I am using the MAX471 for a project at school for measuring a solar panel. The maximum voltage generated is 16,8 V and 0,3 A. The measuring resistor i am using is 58 ohm. Is this then the correct code for reading the current and voltage?
int VoltageRaw= analogRead(A4);
float Voltage= VoltageRaw* (16.8/ 1023.0);
int CurrentRaw = analogRead(A5);
float Current= (CurrentRaw * (16.8 / 1023.0) / 58);
Hi, I am uncertain if I understand what exactly you are doing. The MAX471 has an integrated shunt (measuring resistor for current), so you don’t need an additional resistor. Where have you attached the 58 Ohm resistor? And why?
The MAX471 is detecting the voltage drop across its internal shunt. This voltage is amplified by a fixed factor. This leads to an output voltage at OUT that is proportional to the current. The correlation factor is 1 V per 1 A, or: 1 mV per 1 mA. If you produce max. 0.3 volts you will measure up to 300 mV. So, your resolution won’t be high.
Of course, you can just omit the MAX471, choose your own shunt, let the current flow through the shunt, measure the voltage and calculate the voltage. This is basically what I have presented here:
https://wolles-elektronikkiste.de/en/current-sensor-how-to-build-it-yourself
But shunts should be small, typically 0.1 ohms or smaller, to not influence the current you want to measure. This leads to small voltages which need to be amplified. That is the challenge.
So, before I can answer your question, you need to provide more details. If you have a circuit diagram, photos, etc. you can send it to: wolfgang.ewald@wolles-elektronikkiste.de.
Hello mister Wolfgang, thank you for your article.
I have a question regarding the GY-471 module.
I have a model train and would like to measure the current in a block.
As I can reverse the direction of the train, therefore the voltage across the rails, is this a problem for the GY-471 module, if I have the RS+/RS- inputs which are once +/ – and once -/+?
If so, how can I measure independently of the direction, for example with a bridge rectifier?
Thank you for your response and have a great weekend.
Cordially
Dario
Hi Dario, you can measure the current in both directions. You will always get a positive output from the OUT pin, but the sign pin will tell you the direction of the current RS+ to RS- or RS- to RS+. Good luck and have fun! Best wishes, Wolfgang
Hello Wolfgang,
Thank you for your prompt reply.
I am very happy with the way it works.
Sorry, another question I forgot to ask you.
Can the power supply be totally different from the current measurement or must the negative be common?
Have a great week and best regards.
Dario
Not sure, I have not tried. Maybe you can just try yourself and see what happens. What definitely is important is to connect GND of the MAX471 with GND of the Arduino.
Shouldn’t the green wire be between columns F-I and not A-E? Between A-E, it is not connected to anything in your example or am I wrong?
The negative (-) of the Arduino must be the same as the negative (-) of the power supply or power consumer or it can be different? I think different because I could power the Arduino with a battery for example.
Is the purple wire mandatory or not? Is it if we want to have the information of the direction of the current?
How should the voltage divider be done?
Thank you again for your answers.
The green line should be connected to the yellow (or directly be colored yellow). I have just changed it. If you look at the sketch, it’s also obvious:
const int signPin = 8;
If you are not interested in the bus voltage and bus power, you don’t need the purple line (it’s pink I would say, but I know what you mean).
If your bus voltage is higher than 5 V you need a voltage divider. The ratio of the resistor values depends on the bus voltage. The size of the resistors should be high enough to avoid too much current. If you want to reduce the voltage, let’s say by two thirds, then I would take something 10 and 20 kilohms.
Good morning Wolfgang,
Thank you very much for your answers.
Now, I will order the parts and do some tests.
You answered me by talking about the MAX471 (What definitely is important is to connect GND of the MAX471 with GND of the Arduino.), I would like to work with the GY-471, is your answer also suitable for the GY-471?
As you can see on the images the MAX471 I used is labelled as GY-471. I think this answers the question.
I am happy to answer your questions, but I suggest you just start “playing” with the module. And if something is not working as expected you can contact me of course. As long as you don’t produce short circuits or exceed currents and voltages beyond the specified limits, it’s save.
Tahnk you very much.
Now, I have my answers and I can order and “playing” 😉
Have a nice day.
best regards.
Dario