
About this post
Much has already been published about strain gauges. However, there are very few articles that really show concretely how to connect the strain gauge and evaluate the measured values with a microcontroller. I would like to close this gap with this article. Specifically, I will cover the following:
- General information about strain gauges
- Wheatstone bridge circuit
- Strain gauge measurements with the HX711
- Strain gauge measurements with operational amplifiers
- For the lazy ones: a ready-made solution
General information about strain gauges
What is a strain gauge and how does it work?
A strain gauge is a stretchable resistor whose resistance value changes linearly with strain. There are a wide variety of shapes and materials. The classic that you can get for little money in online shops is the foil strain gauge:

The foil strain gauge consists of a carrier foil on which a thin metallic conductor path is located. The metal used is often constantan or another alloy with low temperature dependence. An overview of different strain gauge designs can be found on the recommendable web pages of HBM.
The principle of operation of a strain gauge is simple. The resistance of a body depends (among other things) on the specific electrical resistance of the material, the diameter and the length. If the strain gauge is stretched, the diameter of the conducting path is reduced and the conducting path becomes longer. Consequently, resistance is increasing. In the case of compression, on the other hand, it is the other way around.
Strain gauge characterization
A strain gauge has a certain base resistance. The most common are strain gauges with 120 or 350 ohms. These values are not standardized, but have simply become established. The sensitivity of the strain gauge is described by its so-called k-factor. For a resistor R of a length l:
![\[ \frac{\Delta R}{R}=k\cdot\frac{\Delta l}{l} \;\;\;\;\;\Rightarrow\;\;\;\;\;\Delta R=k\cdot\frac{\Delta l}{l}\cdot R \]](https://wolles-elektronikkiste.de/wp-content/ql-cache/quicklatex.com-ea11a25fcc3fe2b853688fea789f0c3c_l3.png "Rendered by QuickLaTeX.com")
The maximum elongation of commercially available foil strain gauges is often specified as 2%. The k-factor is usually 2 to 2.2. This results in the following maximum resistance change for a 120 Ohm strain gauge:
![\[ \Delta R_{max}=2.2\cdot 0.02\cdot 120 = 5.28\; [\Omega] \]](https://wolles-elektronikkiste.de/wp-content/ql-cache/quicklatex.com-4c32e7948e0c308a596355d459d65262_l3.png "Rendered by QuickLaTeX.com")
In most cases, however, you work far below the maximum limits. The relative resistance changes to be measured are correspondingly small. Since resistors are measured by the voltages that drop across them, the same is true for voltages. Typically, fractions of millivolts must therefore be measured.
The Wheatstone Bridge Circuit
The measurement of low voltages is not a problem in itself. The sticking point is the small relative change due to the large underlying. To measure only the voltage change, you can use the Wheatstone bridge circuit:
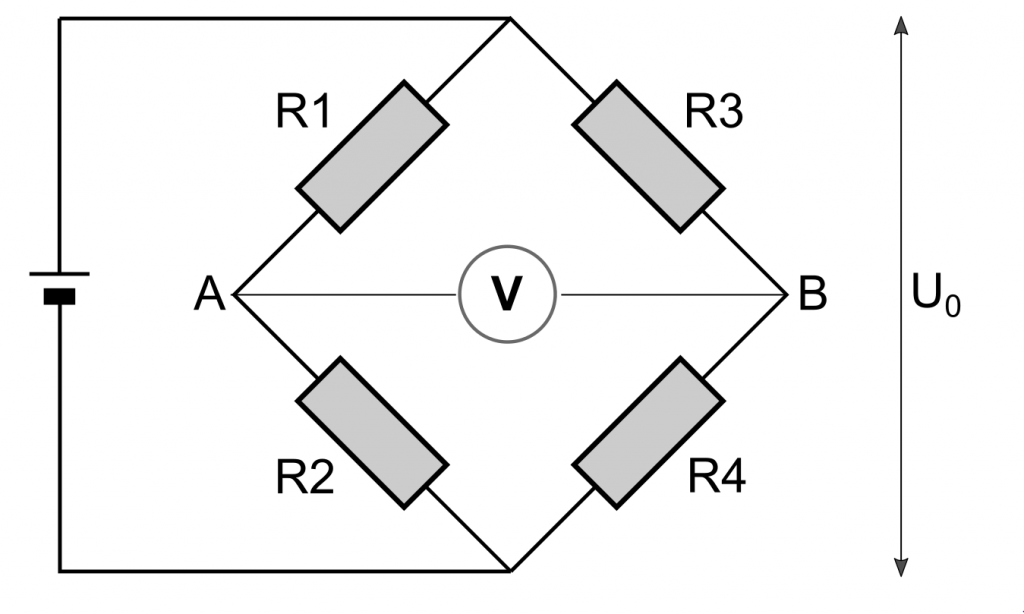
I do not want to go too far with the explanation. If you need further information on the basics, I recommend the relevant HBM pages. Here are the main points:
- R1 and R2 or R3 and R4 are resistors connected in series.
- The resulting resistors R1+R2 and R3+R4 are connected in parallel.
- If R1 = R2 = R3 = R4, then the total resistance is R1.
- R1 and R2 or R3 and R4 are voltage dividers. The voltage at points A and B is determined accordingly by the ratio of R1 to R 2 and of R3 to R 4, respectively.
- The bridge is balanced when the voltage between A and B is zero (for U0 ≠ 0). In this case:
![\[ \frac{R1}{R2} = \frac{R3}{R4} \]](https://wolles-elektronikkiste.de/wp-content/ql-cache/quicklatex.com-16a9fc23dba87d1ba4ed370e1db1b0b1_l3.png "Rendered by QuickLaTeX.com")
So if you use a strain gauge as R1, R2 corresponds to the base value of the strain gauge and R3 is equal to R4, then the bridge is balanced. Accordingly, you only measure the voltage caused by the strain or compression of the strain gauge.
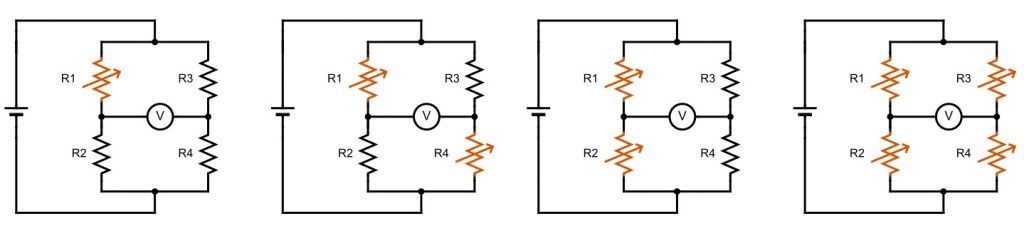
Using multiple strain gauges
In practice, several strain gauges are often used. The arrangement of the strain gauges in the Wheatstone bridge depends on which of them are stretched or compressed. If you use two strain gauges, and both are stretched or compressed at the same time, then you have to install them diagonally opposite (R1/R4 or R2/R3). If one strain gauge is stretched and the other compressed, they must be positioned on one side (R1/R2 or R3/R4). When using four strain gauges, you must proceed in the same way: The antagonists are positioned on one side, the synchronously operating strain gauges are arranged diagonally opposite.
There are several reasons for using multiple strain gauges:
- Stronger signals
- Less noise
- Compensation of thermal expansion
- Separation of normal and bending elongation
A detailed article can be found here.
Gluing and wiring the strain gauges
Gluing of strain gauges is a science in itself. The choice of the optimum adhesive depends, among other things, on the application temperature, the surface roughness and the expected elongation. Again, I recommend taking a look at the HBM pages. The problem is that these adhesives are quite expensive. However, the good news is that you can use ordinary cyanoacrylate glue (superglue) if you do not need the highest precision and the elongation is not too high. There are also special products for use as a protective layer for strain gauges. I just used simple tape in my experiments.
If you use strain gauges with pre-installed connection cables, you must check whether the cables are insulated and take appropriate measures. If your strain gauges do not have wires, you should solder them on before you glue them on. That’s a little fiddly, but it works. In addition, it is recommended to twist the connection cables (which I read too late!).
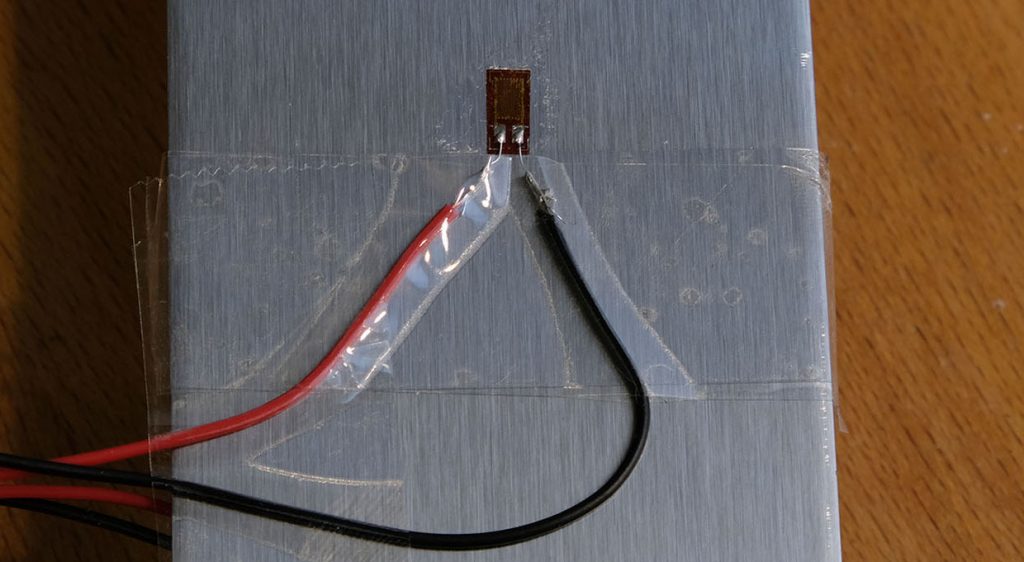
When gluing, be careful not to get your fingers glued down. I pressed the strain gauges on with household foil. And less glue is more! Thick adhesive layers are counterproductive.
I had first soldered cut jumper cables to the strain gauges and built the Wheatstone bridge on the breadboard. I thought this was a good idea to stay flexible for my experiments. However, I advise against this. The contact resistances are not negligible. Every touch of the cables changed my readings. It wasn’t until I firmly soldered Wheatstone bridge that my readings became stable.
Strain gauge measurements with the HX711
Maybe one or the other of you has previously dealt with HX711 based scales. The load cells and the HX711 module are sold in a set. I once removed the protective layer of a load cell and lo and behold: four strain gauges (two at the top, two at the bottom) come to light. So it is obvious to use the HX711, or – conveniently – an HX711 module for measurements with strain gauges.
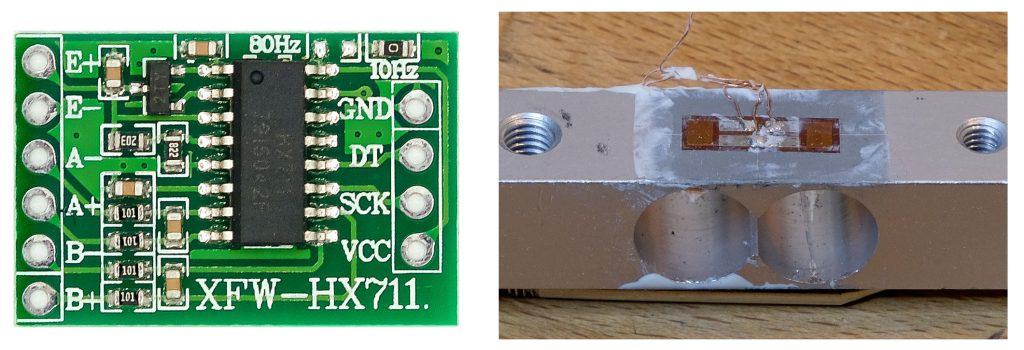
The HX711
The HX711 is a 24 bit (!) ADC that is particularly suitable for voltage measurements on Wheatstone bridges. It is operated with 2.6 to 5.5 volts. The pins E+ and E- provide the supply voltage for the Wheatstone bridge (U0 according to my figure above). The output voltage of the bridge (points A and B in my drawing) is read at pins A+ and A- (channel A).
You can choose between two gains, namely 128 and 64. At 5 volts input voltage, this corresponds to a measuring range of +/-20 or +/-40 mV. Alternatively, you can use channel B (connections B+/B-). However, this has only a gain factor of 32. This results in a measuring range of +/-80 mV at 5 volts input voltage.
The module has a conversion frequency of 10 Hz preset. To change it to 80 Hz, desolder the (zero) resistor at the 10 Hz label and connect the contacts at the 80 Hz label. However, 10 Hz should be sufficient for most applications.
There are no more settings. A data sheet for the HX711 can be found here.
Connection to the MCU
Here is an example of connecting the HX711 to a Wheatstone bridge (simplified below) and a microcontroller:
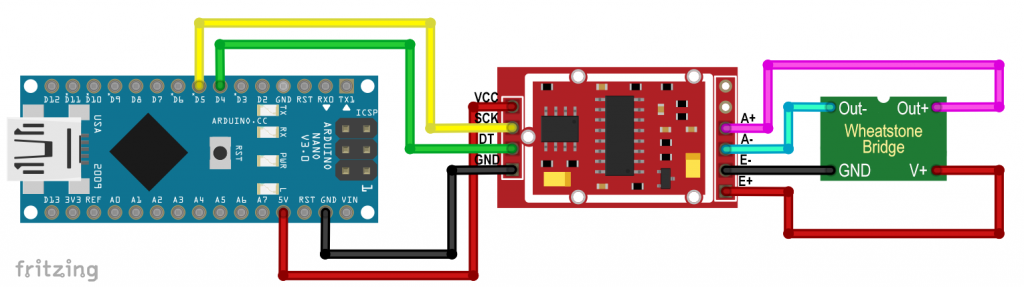
Reading / Controlling the HX711
The HX711 outputs its measured values via DOUT. In its basic state is DOUT HIGH. The HX711 is controlled solely via the SCK pin. You first set the SCK level to LOW.
When a measured value is available for retrieval, DOUT goes to LOW. Then you can read out the measured values bit by bit, starting with the MSB, i.e. the highest (most significant) bit. To do this, switch SCK briefly HIGH and LOW again. If the MSB (bit 23) of the measured value is a 1, DOUT is now HIGH, otherwise LOW. You read DOUT, then you send a short SCK signal again. Now the state of DOUT shows whether the bit 22 is set. So this continues to bit 0. You put the measured value together bit by bit.
After reading bit 0, DOUT goes permanently to HIGH with the next (i.e. the 25th) SCK signal. If you leave it at that, then you will receive the next measured value via channel A with gain 128. If you send another SCK signal, then you will receive the next measured value via channel B with gain 32. If you send another SCK signal, then you will receive the next measured value via channel A with gain 64. This completes a readout and setting sequence. Then everything starts all over again with DOUT going LOW. So you control the parameters for the next measurement during the reading of the current measured value.
This is how it looks schematically:
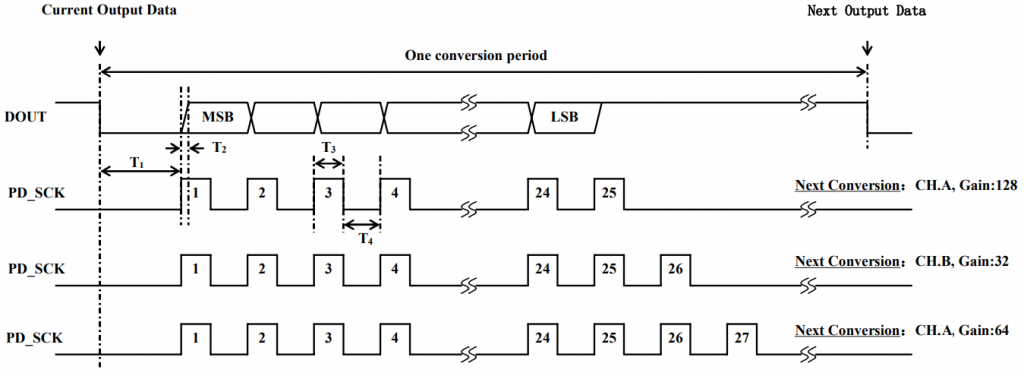
The data sheet contained a small error. Gain 64 is on channel A. I have corrected this here.
The measured value is supplied as a two’s complement. The number range is from 0x800000 (= -8388608) to 0x7FFFFF (= +8388607). Even if you define the measured values as a signed “long” variable (32 bits), the negative numbers would be misinterpreted as positive numbers without further precautions. This is because the highest, 31st bit (counting starts at zero) of the “long” variable is always 0. The trick: you just flip bit no. 23. This shifts the value range to 0….16777216.
Sketch for reading the raw data
This may all seem a bit confusing. However, the programming is simple:
#define GAIN_128 25
#define GAIN_64 27

const int doutPin = 4;
const int sckPin = 5;

void setup() {
  Serial.begin(57600);
  pinMode(doutPin, INPUT);
  pinMode(sckPin, OUTPUT);
}

void loop() {
  unsigned long raw = readHX711();
  Serial.println(raw);
  delay(500);
}

unsigned long readHX711(){
  unsigned long data = 0;
  uint8_t dout;

  while(digitalRead(doutPin)){}  // wait until value is available
  for (uint8_t i=0; i<GAIN_128; i++){   //highest Gain
    //delayMicroseconds(1); // uncomment for fast MCUs
    digitalWrite(sckPin, 1);
    //delayMicroseconds(1); // uncomment for fast MCUs
    digitalWrite(sckPin, 0);
    if (i < (24)){
      dout = digitalRead(doutPin);
      data = (data << 1) | dout;
    }
  }
  data = data ^ 0x800000; // flip bit 23

  return data;
}

void powerDown(){
  digitalWrite(sckPin, LOW);
  digitalWrite(sckPin, HIGH);
}

void powerUp(){
  digitalWrite(sckPin, LOW);
}
A few more explanations:
- The SCK signals (i.e. the HIGH and LOW phases) should be at least 0.2 μs long. Fast MCUs like the ESP32 can fall short of these times, so you need to add delays.
- If the SCK pin is in HIGH state for more than 60 μs, the HX711 goes into a power-down state and consumes only 1.5 μA of current. The power supply for the rather power-hungry Wheatstone bridge is also interrupted.
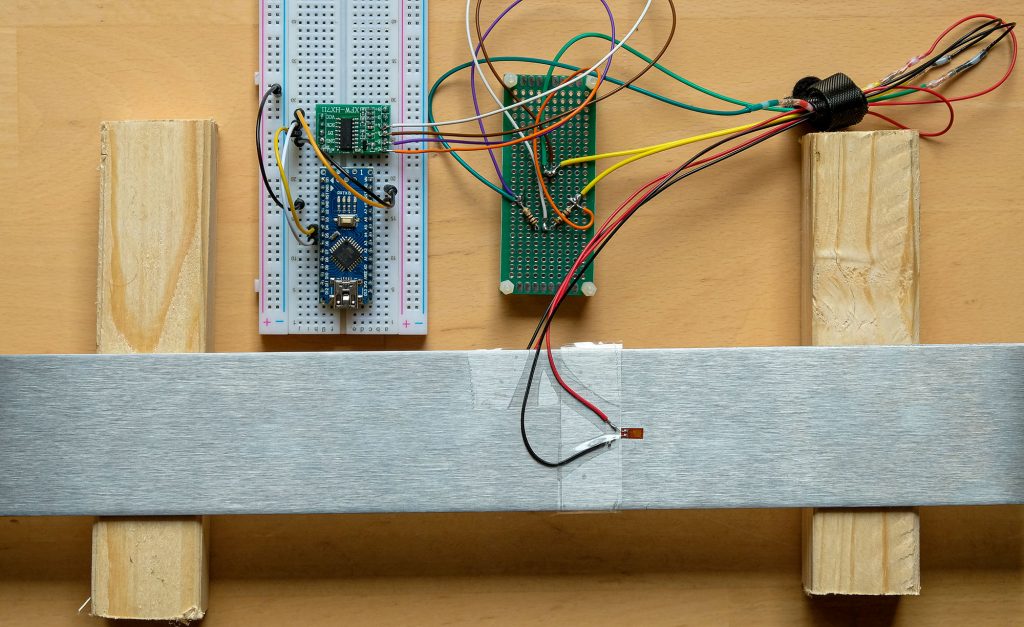
A practical test with strain gauges and the HX711
My goal was to build a primitive scale using strain gauges, a metal strip and the HX711. Not so much to really have a scale, but to check how accurately and reproducible you can measure with strain gauges and a simple experimental setup. I simply placed the metal strip on two pieces of wood. Applied weights bend the strip and I measured this with strain gauges.
I made a first attempt with a half bridge, a second with a full bridge. In the half-bridge test, I used 120 ohm strain gauges and 100 ohm resistors on the opposite side. Since I only used a small part of the measuring range of the HX711, I did not have to balance the bridge.
In my experiments with the half-bridge, the metal was not well suited. When placing weights, a stable measured value was achieved only slowly. When the weights were removed, the readings changed slowly and did not completely return to baseline. In other words, the metal has not only deformed elastically, but also plastically.
The metal strip I used my full bridge test was more suitable. Using a known weight (54 g), I determined a slope factor (rawToWeight) and calibrated the “scale” this way. I also applied a tare button. This is what the sketch looked like:
const int doutPin = 4;
const int sckPin = 5;
const int taraPin = 7;
const float rawToWeight = 11296.3; // units per gram
long tara = 7385000;

void setup() {
  Serial.begin(57600);
  pinMode(doutPin, INPUT);
  pinMode(taraPin, INPUT);
  pinMode(sckPin, OUTPUT);
}

void loop() {
  unsigned long raw = readHX711();
  if(digitalRead(taraPin)){
    tara = raw;
  }
  float weight = ((long)raw - tara)/rawToWeight;
  Serial.print("Raw result: ");
  Serial.println(raw);
  Serial.print("Weight [g]: ");
  Serial.println(weight);
  Serial.println("****************");

  delay(500);
}

unsigned long readHX711(){
  unsigned long data = 0;
  uint8_t dout;
  while(digitalRead(doutPin)){}
  for (uint8_t i=0; i<25; i++){
    //delayMicroseconds(1);
    digitalWrite(sckPin, 1);
    //delayMicroseconds(1);
    digitalWrite(sckPin, 0);
    if (i < (24)){
      dout = digitalRead(doutPin);
      data = (data << 1) | dout;
    }
  }
  data = data ^ 0x800000; // flip bit No 23

  return data;
}

void powerDown(){
  digitalWrite(sckPin, LOW);
  digitalWrite(sckPin, HIGH);
}

void powerUp(){
  digitalWrite(sckPin, LOW);
}
And here is the output with different, known weights. To get this output, I lowered the output frequency to have enough time to change the weights.
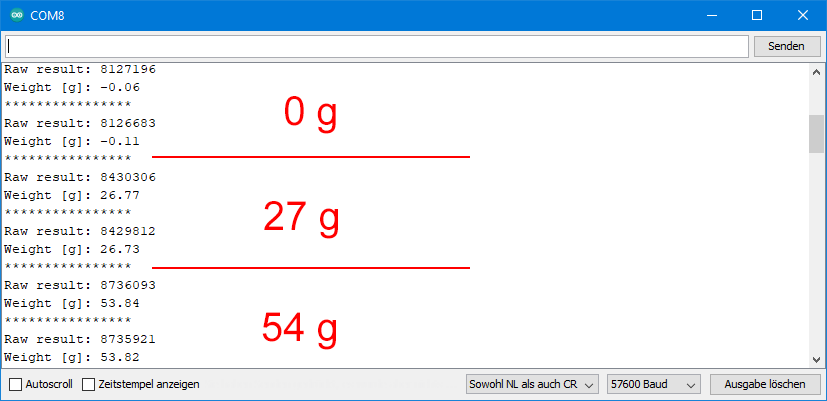
Not so bad, right? A certain deviation in this design of a scale is because the weighing material must always be placed exactly in the same place. As mentioned before, I didn’t aim to build a scale. I just wanted to show that strain gauges can be used excellently with the HX711.
Strain gauge measurements with operational amplifiers
General information about op amps
I could easily fill several posts with the topic of operational amplifiers (op amp for short). That is why I am not going to explain them in detail here. If you want to take a closer look, I recommend this web page. Just this much:
- Op amps are used for voltage amplification.
- They have an inverting (“-“) input, a non-inverting input (“+”) and an output (VOUT).
- The power supply of op amps often covers a negative and positive range (i.e. from +x volts to -x volts), but there are also applications with just positive power supply (V+ / GND). For simplicity, I use the latter method here.
- The op amp only gets its function by wiring with other components (primarily by resistors).
- Op amps can be used as inverting or non-inverting amplifiers, as differential amplifiers, integrators, etc.
The op amp ICs in DIP format with 8 pins contain two op amps. Here are a few common representatives:

The pinout scheme is the same for all the above representatives:

Instrumention amplifiers
First I tried the so-called instrumentation amplifier circuit. Usually, it contains three op amps, but there’s also a simpler version with two op amps. I chose the latter version.
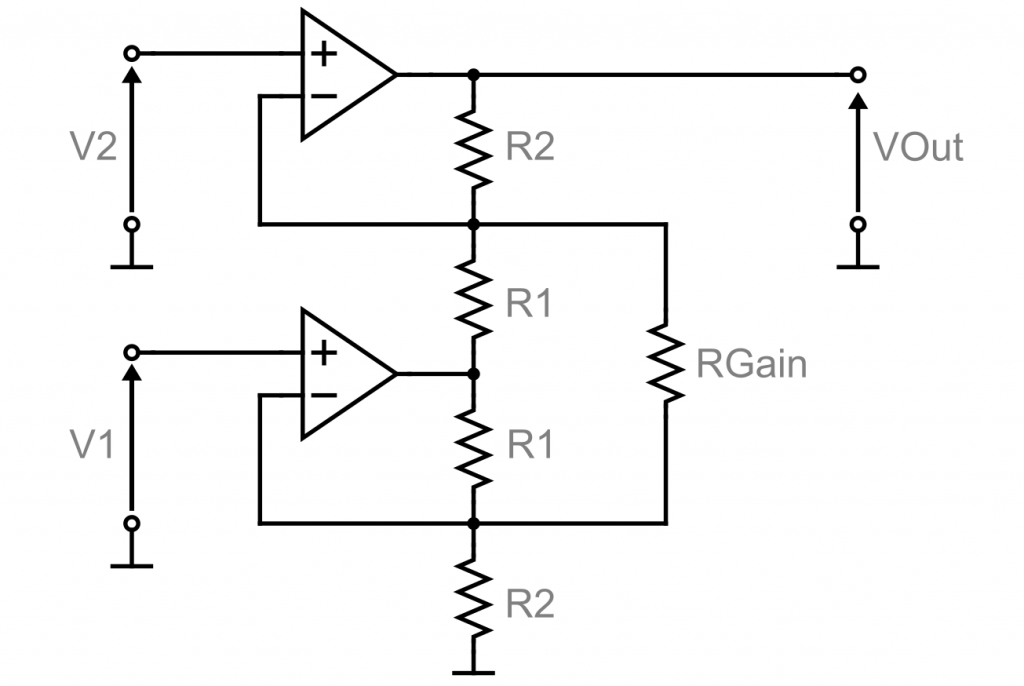
The circuit amplifies the voltage difference between V1 and V2 according to the following equation:
![\[ V_{out}= \left( 1+ \frac{R_2}{R_1}+\frac{2\cdot R_2}{R_{gain}}\right)\cdot \left( V_2 - V_1 \right) \]](https://wolles-elektronikkiste.de/wp-content/ql-cache/quicklatex.com-cc0f1492dd95896fe306140390d8c50f_l3.png "Rendered by QuickLaTeX.com")
V1 and V2 are the voltages at points A and B (see below) of the Wheatstone bridge. There is something important to consider. If V1 is greater than V2, then VOut should be negative. However, this would only work if you supplied the op amp with negative voltage. The solution: You attach another potentiometer with which you can adjust the bridge voltage between A and B. Bring the output voltage to the positive range enough to measure the expected values. The potentiometer should be rather high-impedance because then setting is easier. I used a 1 MΩ potentiometer.

You can measure the amplified voltage directly with the ADC of your microcontroller. However, these internal converters are often not particularly accurate, as e.g. the ADC of the Arduino UNO or the ESP32. Better is an external A/D converter like the ADS1115.
Practical example of strain gauge measurements with an instrumentation amplifier
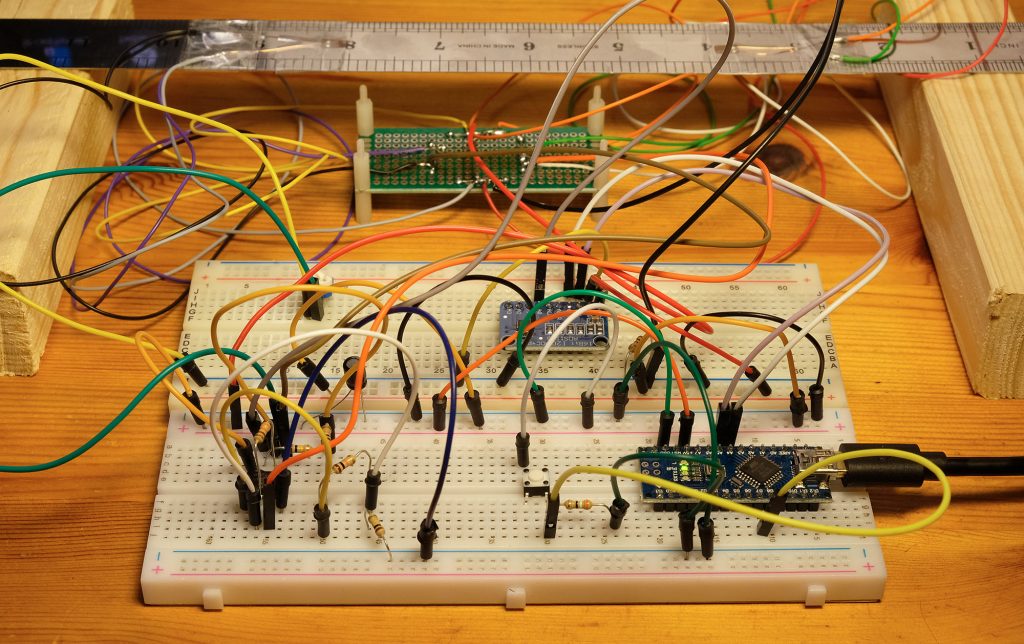
Again, I used my metal strip with the full bridge and tried to measure weights. For the instrumentation amplifier I used the following resistors:
- R1 = 10 kΩ
- R2 = 100 kΩ
- RGain = 330 Ω
This results in a gain factor of ~617.
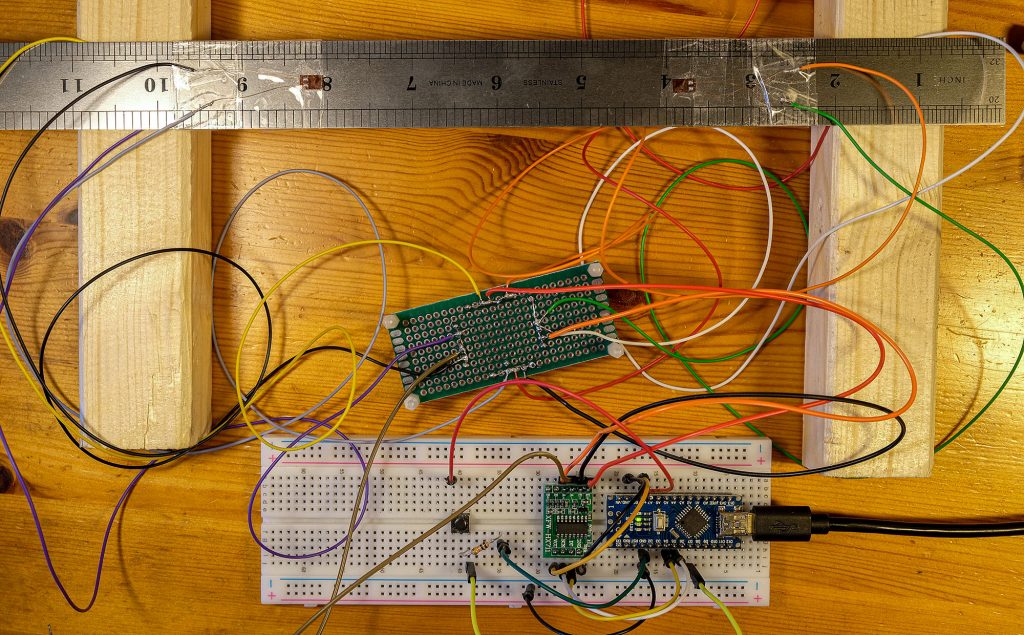
This is what the circuit looked schematically with Fritzing:

And in reality:
And here is the sketch:
#include<ADS1115_WE.h>
#include<Wire.h>
#define I2C_ADDRESS 0x48
const int taraPin = 7;
const float milliVoltToWeight = 12.15;

ADS1115_WE adc = ADS1115_WE(I2C_ADDRESS);

void setup() {
  Wire.begin();
  Serial.begin(9600);
  adc.setVoltageRange_mV(ADS1115_RANGE_6144);
  adc.setMeasureMode(ADS1115_CONTINUOUS);
}

void loop() {
  float weight = 0.0;
  static float tara = 0.0;
  float voltage = adc.getResult_mV();
  if(digitalRead(taraPin)){
    delay(2000);
    voltage = adc.getResult_mV();
    tara = voltage;
  }
  weight = (voltage - tara)/milliVoltToWeight;
  voltage = adc.getResult_mV();
  Serial.print("Voltage 0 vs GND [mV]: ");
  Serial.println(voltage);
  Serial.print("Weight [g]: ");
  Serial.println(weight);
  delay(500);
}
I had noticed that pressing the tare button affects the reading (interesting finding!). That is why I have included a delay(2000) in line 21.
With a known weight, I determined the conversion factor from millivolts to grams (milliVoltToWeight). This is what the output looked like after pressing the tare button and after applying a 54 g weight:
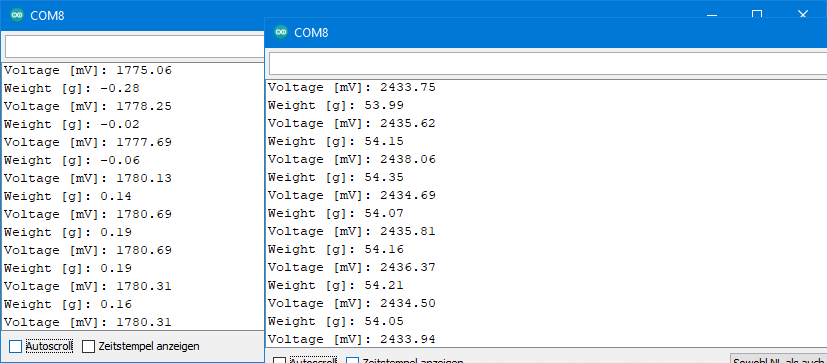
Not so bad either, I think. By using averaging or damping functions, the noise of the values can be reduced.
Differential amplifier
Alternatively, you can use a differential amplifier circuit. his requires only one operational amplifier and one less resistor.

If R1 = R2 and R3 = R4, then the following applies:
![\[ V_{out}=\frac{R_3}{R_1}\cdot \left( V_2-V_1\right) \]](https://wolles-elektronikkiste.de/wp-content/ql-cache/quicklatex.com-d9d972df5b467b8d8bacedaaa09e5b3f_l3.png "Rendered by QuickLaTeX.com")
Here, too, you have to make sure that (V2 – V1) does not become negative. So, I added a potentiometer again to set the baseline of the bridge output voltage to a positive value.
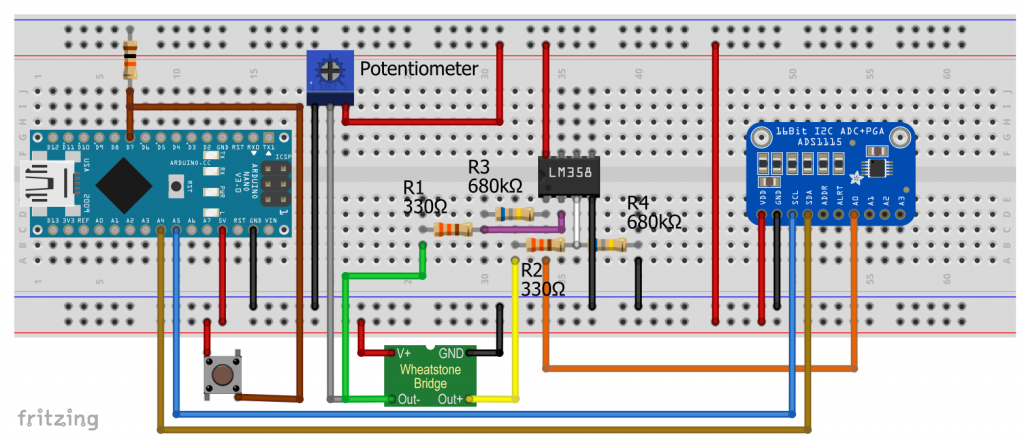
In my experiments, I used full bridge again. The resistors R1 and R2 for the OpAmp were 330 ohms, R3 and R4 were 680 kOhm. This results in a gain factor of ~2061. This allowed me to achieve similarly good results as with the instrumentation amplifier circuit.
For the lazy ones: a ready-made solution
If you do not feel like soldering and you can get by with a single strain gauge, then I can recommend such a ready-made solution:
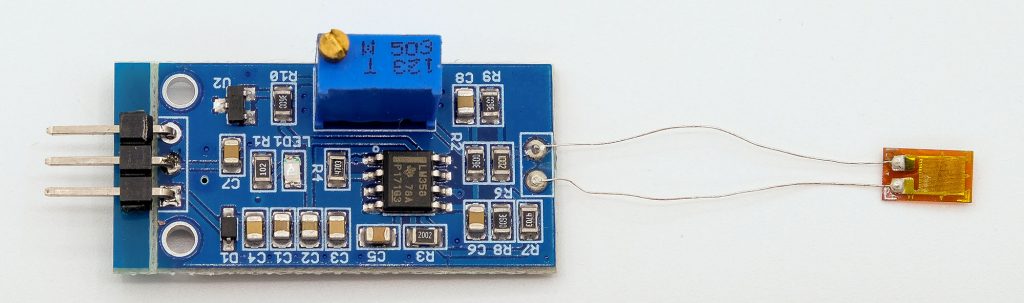
On the module there is an LM358 based amplifier circuit with fixed gain factor. The potentiometer is used to set the zero point. In principle, this is similar to the circuits described before. You only have to connect 5 volts and can read the output voltage directly. I tried such a part and it worked flawlessly. You can get these modules on eBay or AliExpress for a few euros. Just search for “strain gauge” or “strain gauge module”.
Acknowledgement
The lady with the stretching exercise on the post picture, I owe Pexels on Pixabay.
Bruce Tsao created the HX711 as a Fritzing component. You can get it here on GitHub.
Hello
I’m using a shield HX711 in my project with esp32.
However, during the measurements, some inconsistent values always appear.
I would like to know if there is a way to avoid this?
Hi, I am always happy to help, but I think I need a few more details. Have you applied the same circuit and used the same sketches like the ones in my post? And what does inconsistent mean? Is there noise? Or is there a trend that measured values increase or decrease over time? Or do you get just occasionally results which differ much from the other results?
I am referring to the fact that completely meaningless values appear.
Sorry, but I need to know as exactly as possible what you have done. Otherwise, I won’t be able to help. There are just too many parameters (circuit, program, how you applied the strain gauges).
Did you take the same circuit as I used? With four strain gauges or two? What kind of strain gauges (resistance)? Did you take the same sketch? If you want, you can send me photos of your circuit (wolfgang.ewald@wolles-elektronikkiste.de).
Dear Wolfgang Ewald
I have tried the example with the differential amplifier example. Two changes were made i.e in place of the Arduino nano I have an ESP32 (loin32) with vdd of ads1115 connected to the ESP32 +ve 5 volts supply voltage and since there were no 1 mega-ohm trim-pots a 500 ohm was used. The setup works fine. I however noticed that the voltage is varying over time. For example in 30 minutes the voltage changed by 100 milivolts when no load was applied. Is it possible to have a stable voltage reading.
I have also had a similar issue with the hx711 raw values example. The raw values vary. I wish I could send you a graph but it is not possible to upload it the comment text box.
A final question is how to convert the raw values of hx711 module to actual voltages read on the output of the wheatstone bridge so that engineering strain values can be obtained using the formlae in HBM manual. I have a full bridge setup for measuring bending strains.
Dear Paul,
please send the graph to wolfgang.ewald@wolles-elektronikkiste.de. And maybe also a photo of your setup. If the material on which you applied the strain gauges is not appropriate, it may already bend just by gravity.
Regards, Wolfgang
I want to find out something using Wheatstone bridge. Lets say for that the resistance for the strain gages of the Wheatstone bridge were 350 ohms for instance( R1, R2, R3 and R4), what would the input resistance for the amplifier as well as the feedback resistance for the differential amplifier be? and therefore what would the gain be
The input into the amplifier (output of the Wheatstone bridge) is not a resistance but a voltage (V_O). V_O depends on the supply voltage V_S and the resistance of the strain gauges. As long as the the strain gauges are stretched their resistance is still 350 ohms and the output voltage is zero. Only when the strain gauges are stretched or compressed they will change their resistance, therefore the Wheatstone bridge is imbalanced you will measure a voltage. The change in resistance depends on the k-value and the degree of stretch / compression. You can find the equations to calculate V_O here:
https://www.hbm.com/en/7163/wheatstone-bridge-circuit/
Since I don’t know the k-value of your strain gauges, your supply voltage and the percentage of stretching / compression I won’t be able to calculate the voltage. But typically the output voltage of load cells is a few millivolts. I wouldn’t do too much calculations but just try and play with the gain factor of the amplifier.